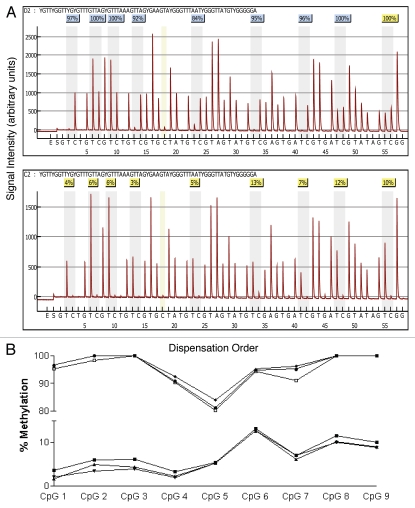
Figure 3.
Comparison of pyrosequencing results obtained from methylated and non-methylated DNA for nine CpG sites spanning the transcriptional start site in the tumor suppressor gene RASS F1. (A) Pyrograms of methylated (top) and non-methylated (bottom) HMEC DNA show the nucleotide dispensation order on the x-axis, the signal intensity on the y-axis, the sequence being analyzed on the top and the percent methylated (gray columns) for each of the nine CpG sites. The narrower tan-shaded column at dispensation 18 marks a bisulfite-treatment control; as a non-methylated cytosine in the genomic DNA (a cytosine not followed by a guanine) will be completely converted to uracil with bisulfite treatment and then replaced with thymidine during the PCR. The dispensation begins with the addition of enzyme (E) followed by substrate (S) and then the dinucleotides. When no deviation from the predicted sequence is encountered and the bisulfite-conversion is ≥96% complete, the methylation score (%) is framed in a blue square at the top of the gray column and considered a perfect call. Small deviations from the expected sequence and/or bisulfite conversions between 92.5 and 95.5% complete are framed in yellow squares and the sequencing results are manually checked before accepting or rejecting the methylation score. Large deviations and/or bisulfite conversions less than 92.5% complete are framed in red squares (none shown) and the methylation score is rejected. (B) Pyrosequencing results from three separate PCR reactions of bisulfite-modified methylated control DNA (top three lines) and non-methylated control DNA (bottom three lines).

