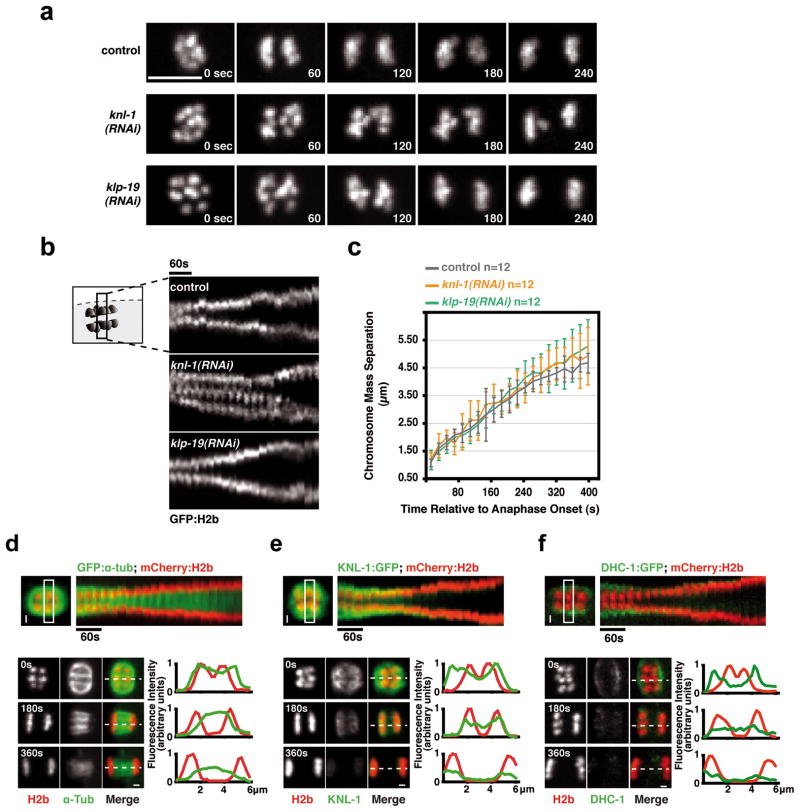
Figure 3. Anaphase chromosome separation on acentrosomal meiotic spindles occurs by a kinetochore-independent mechanism.
(a) Anaphase I in control, KNL-1-depletion and KLP-19 depletion. Scale bar, 5 μm. (b) Kymographs initiated at anaphase I onset; in the KNL-1 depletion the signal in the middle is a lagging chromosome. The time interval between consecutive strips is 20 sec. (c) Graph plotting average chromosome mass separation versus time, aligned with respect to the onset of anaphase I. The average separation speed is ~0.5 μm/min for all 3 conditions. Error bars represent the standard deviation. (d) & (e) & (f) Top: Kymographs from timelapse sequences of control embryos co-expressing mCherry-histone-H2b and GFP-α-tubulin (d) or KNL-1-GFP (e) or DHC-1-GFP (f). Bottom: Stills from timelapse sequences of the three strains aligned relative to anaphase onset. Normalized fluorescence intensity along a 1-pixel-wide linescan (dashed line) is plotted on the right; position 0 corresponds to the left edge of the linescan. Scale bars, 1 μm.

