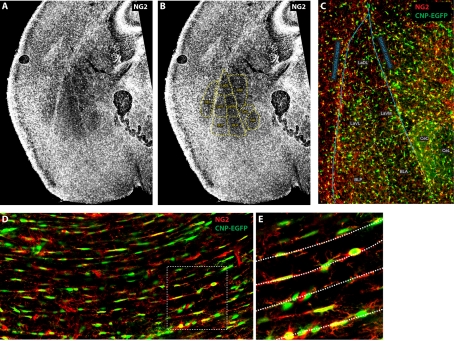
Figure 2. Distribution of NG2 cells in the amygdala and corpus callosum of a CNP-GFP (C-type natriuretic peptide-green fluorescent protein) mouse at 7 days after birth (P7).
(A–C) High resolution images taken with a standard fluorescence microscope showing the distribution of the proteoglycan NG2 (greyscale in A and B, red in C) and the fluorescent protein EGFP (enhanced green fluorescent protein) expressed under the promoter of the OL-specific protein CNPase (green in C) in a P7 mouse (coronal section). The image in (B) is identical with (A), except for the inclusion of an overlay (in yellow) showing the putative location of several amygdala nuclei, where NG2 is expressed at different levels. The higher magnification image in (C) shows that NG2+CNP-EGFP+ cells are particularly dense in the external and amygdala capsule and that their density varies for each nucleus. Astr: amygdalostriatal transition; BLA: basolateral amygdala nuclei, anterior; BLP: basolateral amygdala nuclei, posterior; CeC: central amygdala nucleus, capsular; CeL: central amygdala nucleus, lateral division; DeN: dorsal endopiriform nucleus; LaDL: lateral amygdala nuclei, dorsolateral; LaVL: lateral amygdala nuclei, ventrolateral; LaVM: lateral amygdala nuclei, ventromedian. (D, E) Single confocal image showing the distribution of NG2+/CNP-EGFP+ cells in corpus callosum (coronal section) of a P7 mouse. The image in (E) corresponds to the area surrounded by the dashed box in (D). Dashed lines in (E) indicate chains of NG2+CNP-EGFP+ cells subdividing adjacent bundles of callosal axons

