
Table 2.
Transition matrix showing the amount of observed two-act sequences (dyads)
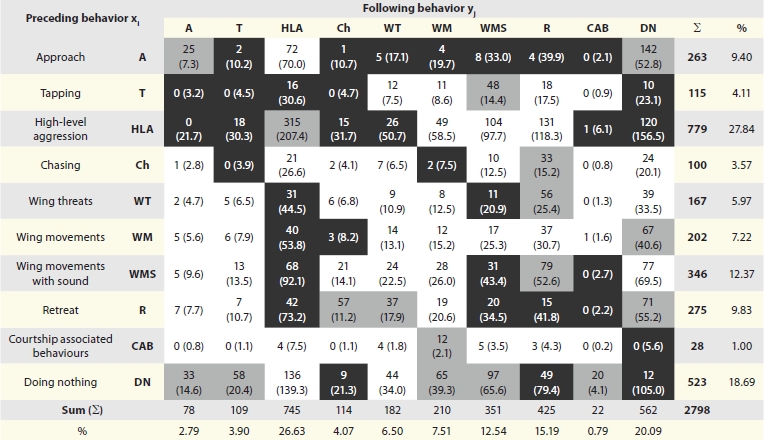 |
The preceding behavior xi is shown in rows, the following behavior in columns, numbers in brackets are expected values. Chi-square tests resulted in non-random distribution of the transitions with p < 0.0001. Light grey marks the cells for which Freeman-Tukey-deviates suggested significant overrepresentation, dark grey marks cells, which are under-represented and white cells are within the statistically expected range, assuming random distribution.