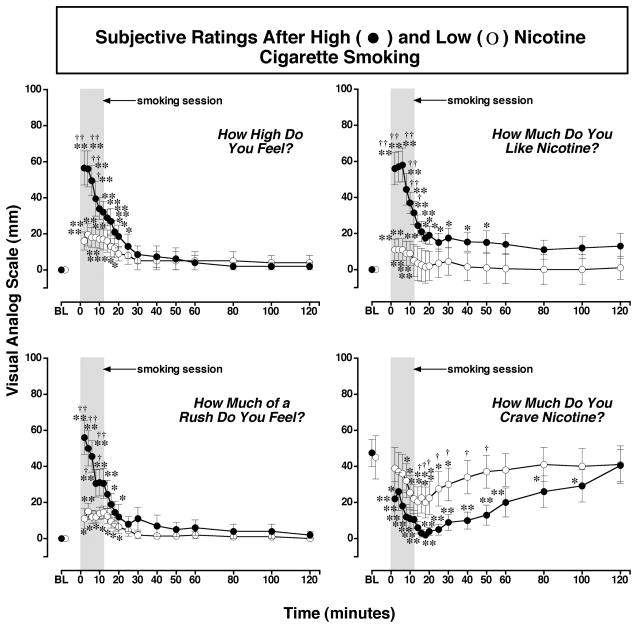
Figure 3. Reports of Subjective Effects After Smoking a Low or High Nicotine Cigarette.
Subjective ratings on a Visual Analogue Scale (VAS) (0–100) are shown on the left ordinates and time (min) is shown on the abscissae. Points above BL were collected 10 min before smoking began at time 0. Each data point is the average (± S.E.M.) of 10 subjects. The 12 min cigarette-smoking period is indicated by a grey rectangle. Asterisks indicate points that were significantly different from baseline (* = P< 0.05; ** = P< 0.01). Statistical analyses indicated significant changes from baseline in reports of “high” after high nicotine cigarettes [df=18, F=16.9, P<.0001] and low nicotine cigarettes [df=18, F=5.2, P=.01; reports of “liking” after high nicotine cigarettes [df=18, F=14.1, P<.0001] and low nicotine cigarettes [df=18, F=3.9, P=.05]; reports of “rush” after high nicotine cigarettes [df=18, F=13.2, P<.0001] and low nicotine cigarettes [df=18, F=5.1, P=.009; and reports of “craving“ after high nicotine cigarettes [df=18, F=8.1, P=.0007] and after low nicotine cigarettes [df=18, F=5.6, P=.007]. Daggers indicate points that were significantly different after high nicotine cigarette smoking than after low nicotine cigarette smoking († = P< 0.05; †† = P<0.01) “high “ [df=1, F=4.5 P=.049], “like [df=1, F=6.2, P=.023], “rush” [df=1, F=6.3, P=.02], and “craving” [df=1, F=5.6, P=.04]. Reprinted with permission from Mendelson, J.H., Sholar, M.B., Goletiani, N., Siegel, A.J. and Mello, N.K.: Effects of low and high nicotine cigarette smoking on mood states and the HPA axis in men. Neuropsychopharmacology 30:1751–1763, 2005.

