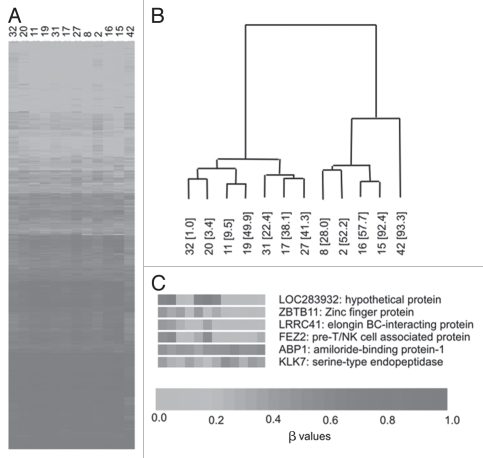
Figure 2.
Hierarchical clustering using BeadArray data across the 12 samples. (A) β values for all 6,532 autosomal CpG sites where values in all samples were ≥0.8 and ≤0.2. (B) Hierarchical clustering results showing two discrete clusters. Sample numbers are shown with birth weight centile in parentheses. (C) Examples of genes showing significant correlations with birth weight centile across the 12 samples.

