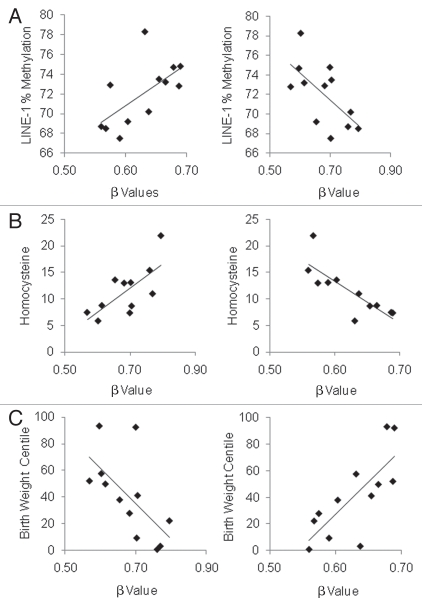
Figure 4.
Examples of two genes BMX (left column) and AMN (right column) with significant correlations with each of (A) mean LINE-1 methylation (%), (B) plasma homocysteine (µmol/L) and (C) birth weight centile (%) (see Table 2). BMX was positively correlated with LINE-1 methylation level (r = 0.631, p = 0.028) and birth weight centile (r = 0.760, p = 0.004) but inversely correlated with plasma homocysteine concentration (r = −0.813, p = 0.002) across the 12 samples. In contrast, AMN inversely correlated with LINE-1 methylation level (r = −0.630, p = 0.028) and birth weight centile (r = −0.637, p = 0.026) but directly correlated with plasma homocysteine concentration (r = 0.709, p = 0.015).

