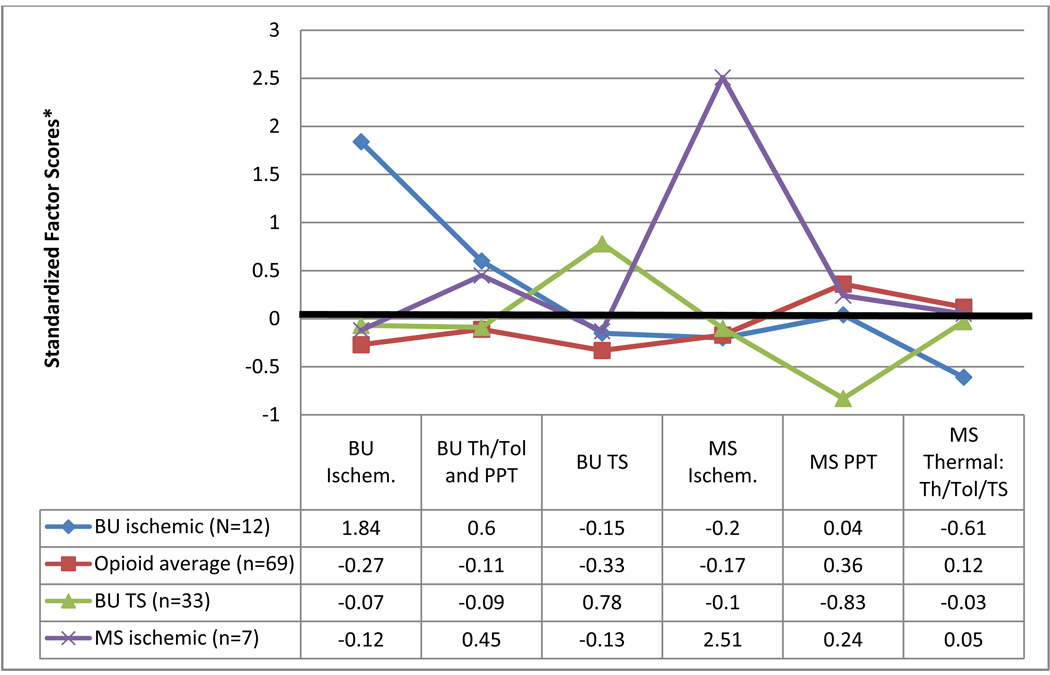
Figure 2. Cluster profile across standardized factor scores.
* Values reported in this figure are standardized factor scores, consequently a value of 0 is equivalent to the group mean, a value of +1.0 represent 1 (SD) above the mean, and −1.0 represents 1 SD below the mean.
BU: butorphanol; MS: morphine; TS: temporal summation; PPT: pressure pain threshold; Th: threshold; Tol: tolerance; ischem.: ischemic

