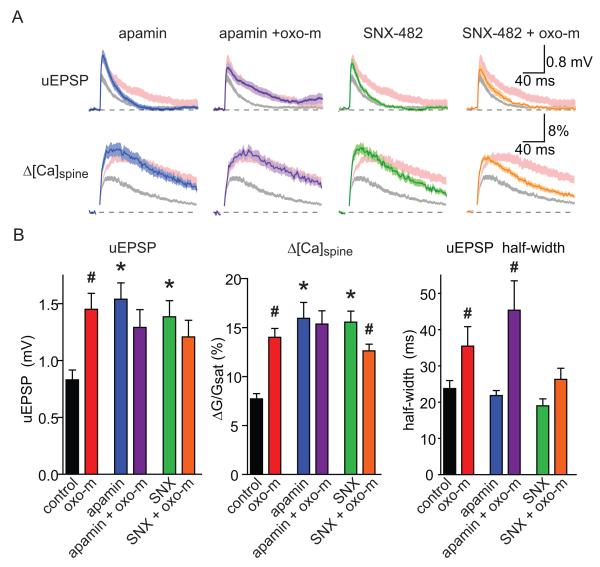
Figure 3. The effects of mAChR activation on synaptic potentials and Ca influx are mimicked and occluded by antagonism of CaV2.3 or SK channels.
A, uEPSPs (top) and Δ[Ca]spine (bottom) measured in the presence of apamin (far left, blue), apamin + oxo-m (left, purple), SNX-482 (right, green), and SNX-482 + oxo-m (far right, orange). The ranges of responses measured in control conditions and in the presence of oxo-m are shown for comparison in shaded gray and pink, respectively.
B, Summary of amplitudes of uEPSPs (left), Δ[Ca]spine (middle), and uEPSP half-width (right) measured in the conditions shown in panel A. For conditions without oxo-m, * indicates a significant difference from control (p<0.05). For conditions with oxo-m, # indicates a significant difference between the indicated condition and the same without oxo-m (p<0.05).

