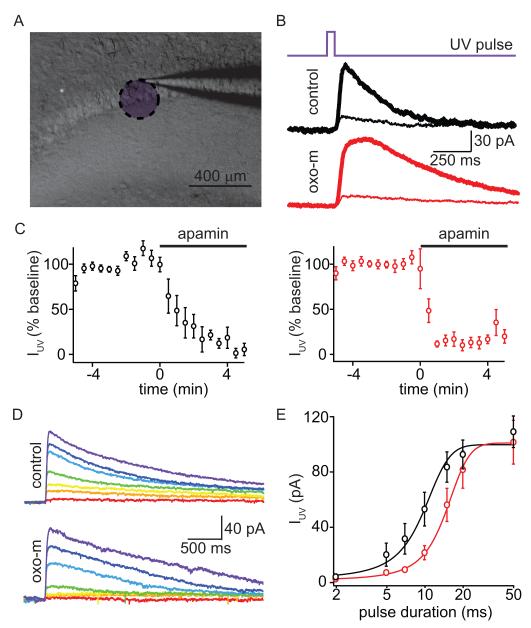
Figure 6. Activation of mAChRs reduces the Ca-sensitivity of SK channels.
A, Low-magnification gradient contrast image (gray) of the hippocampus slice showing the recording electrode with an overlay (purple) indicating the approximate area exposed to UV light.
B, Timing of UV laser pulse (top), and examples of UV light-evoked currents (IUV) measured in control conditions (middle) and in oxo-m (bottom). Currents are shown for the baseline period (thick lines) and after application of apamin (thin traces).
C, Summary of the time courses of the effects of apamin application on the peak of UV-evoked currents in control conditions (black, left) and in the presence of oxo-m (red, right).
D, Average currents evoked by UV laser pulses of a variety of durations in control conditions (top) and in oxo-m (bottom). Colors correlate with increasing duration of UV uncaging pulse (red to purple; 2, 5, 7, 10, 15, 20 and 50 ms).
E, Summary of the peak amplitudes of UV-evoked currents as a function of laser pulse duration measured in control conditions (black) and in the presence of oxo-m (red). The lines depict the best fits to the data using sigmoidal functions.

