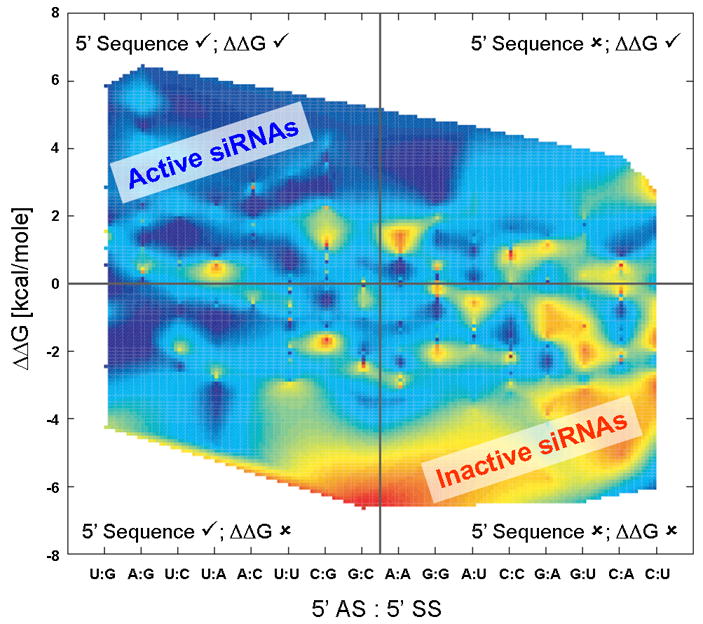
Figure 2. Sorting of siRNA Activity Results (from Shabalina, et. al, [30]).

The activities of siRNAs were plotted according to the 5′ nucleotides on their antisense and sense strands (horizontal axis) and the ΔΔG calculated using 3 nearest neighbors (vertical axis). The data points were then interpolated to simplify visualization of data trends. The scale is red (least active siRNAs; highest mRNA concentration) to violet (most active siRNAs; lowest mRNA level). The figure is divided into the four quadrants where check marks (✓) indicate the approach would identify the correct guide strand, and x’s (✘) indicate the approach would identify the incorrect guide strand. Therefore, sequences in the upper left quadrant are those that would be predicted by both methods to prefer the proper guide strand. Plots using the Novartis data [31] with calculations using 1–4 nearest neighbors are available in the supporting information (Figures S1–S8) but are visually similar to this plot.
