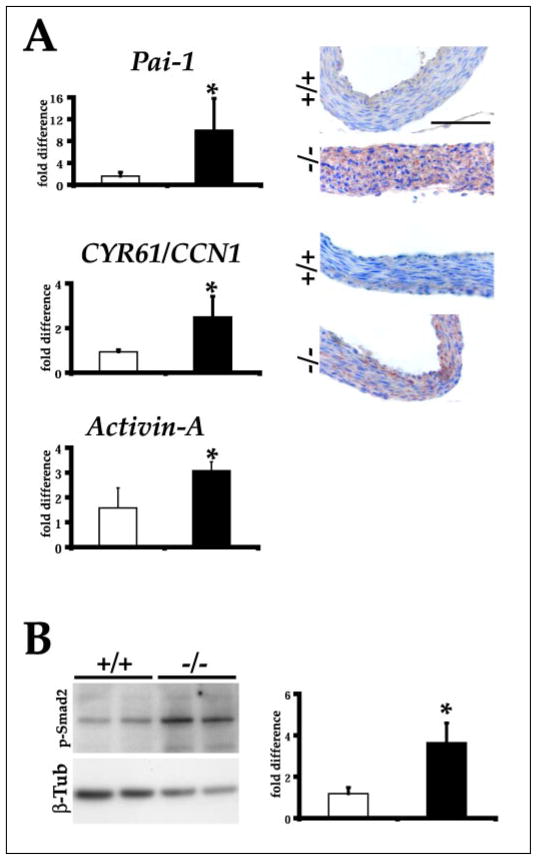
FIGURE 5. Altered gene expression in Fbn1 null aorta.
A, left, bar graphs indicate the mean -fold levels ± S.E. of Pai-1, Cyr61/Ccn1, and activin A transcripts in the aortas of P14 wild-type (open bars) and mutant (filled bars) mice (n = 3 per genotype) as evaluated by real-time PCR. The asterisk indicates statistically significant differences between samples. Right, illustrative immunostaining of PAI-1 and CYR61/CCN1 in the aortas of P14 wild-type (+/+) and mutant (−/−) mice; scale bar, 100 μm. B, left, Western analysis of phosphorylated Smad2 and β-tubulin protein levels in the aortas of P14 wild-type (+/+) and mutant (−/−) mice. Right, bar graphs summarizing the data upon normalization of the Western blot experiments. Bars show the means ± S.E., and the asterisk indicates statistically significant differences between control (open bars) and mutant (filled bars) sample (n = 3 per genotype). β-tub, β-tubulin.

