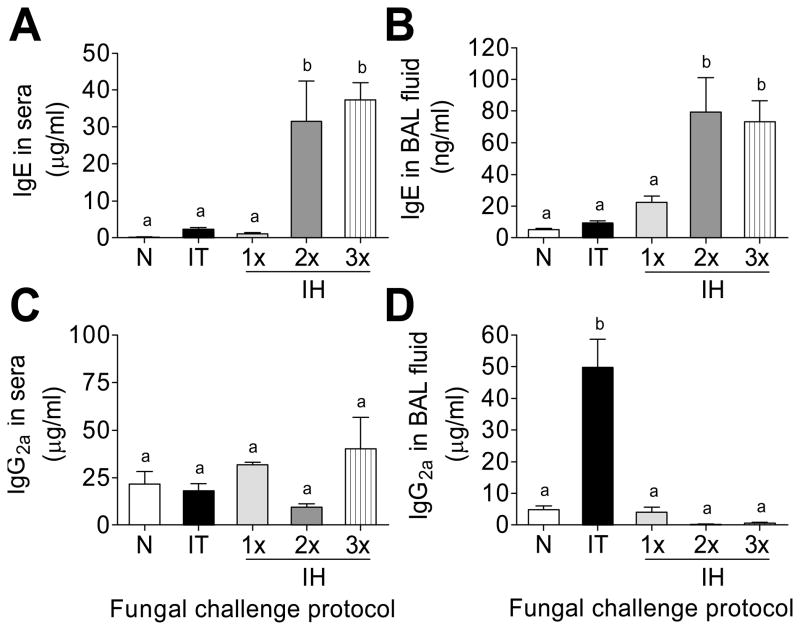
Figure 4.
Immunoglobulin (Ig) quantification 7 days after each challenge protocol with ELISA compared to naïve mice. n=4–5 mice per group. Data analyzed using one-way ANOVA with the Newman-Keuls post test. Bars having no letters in common are significantly different (p<0.05). BAL = bronchoalveolar lavage; N = naïve; IT = intratracheal challenge; 1× 2× 3× IH = single, double, and triple inhalation challenge.

