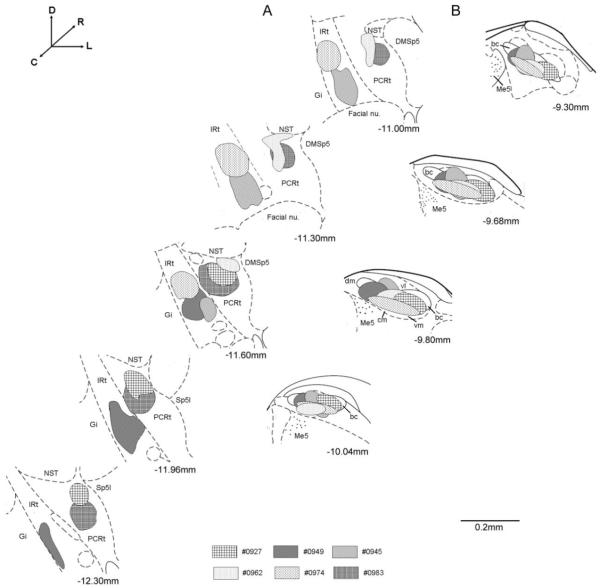
Fig. 2.
Schematic representation of retrograde tracer injections in each animal (n=6). A) Tracer injections concentrated in the IRt and PCRt. B) Tracer injections concentrated in the central medial (cm), dorsal medial (dm), ventral medial (vm) and ventral lateral (vl) subdivision of the PBN. Sections are arranged from rostral (top) to caudal (bottom) and lateral is to the right. The approximate levels relative to bregma are indicated below each photomicrograph (Paxinos and Watson, 1982). bc, brachium conjunctiva; DMSp5, dorsal medial spinal trigeminal nucleus; Gi, gigantocellular reticular formation; IRt, intermediate zone of medullary RF; NST, nucleus of the solitary tract; PCRt, parvocellular zone of medullary RF; Sp5I, interpolar part of spinal trigeminal nucleus; Me5, mesencephalic trigeminal nucleus.

