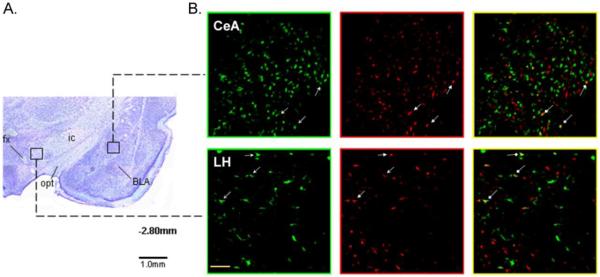
Fig. 4.
Images of cresyl violet-stained brain sections showing the CeA and LH areas in which retrogradely labeled cells were counted (5x). The CeA was identified as the area medial to the basolateral nucleus of the amygdala (BLA) and lateral to the optic tract (opt). The LH was identified as the area sandwiched between the ic laterally and the fornix (fx) medially. The approximate level relative to bregma is indicated below the photomicrograph (Paxinos and Watson, 1982). B) Corresponding photomicrographs (20x) of alternate sections showing GFB-labeled (green panels), RFB-labeled (red panels), and double-labeled (yellow panels) neurons in each forebrain area. Arrows show examples of cells in each forebrain area that project both to RF and PBN. The scale bar in left bottom panel of LH equals 100 um.

