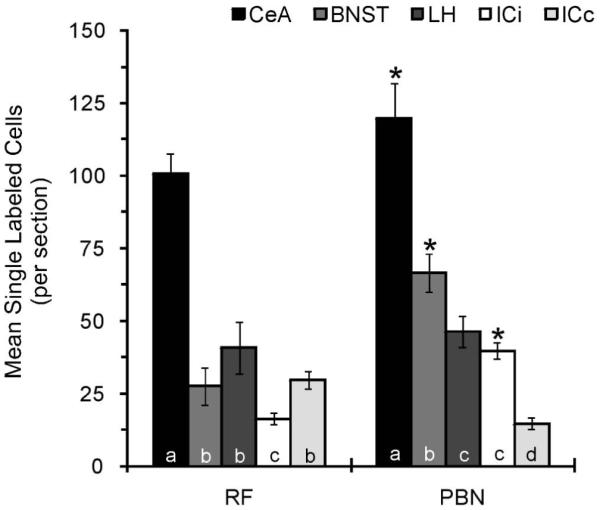
Fig. 6.

The mean number of single retrogradely labeled neurons per section through the CeA, BNST, LH, ICi, and ICc resulting from tracer injection into the RF and PBN. For each hindbrain injection site, statistical analyses are represented by letters where only those bars with the same letter are not statistically different at alpha < 0.05. *, statistical difference between RF and PBN.
