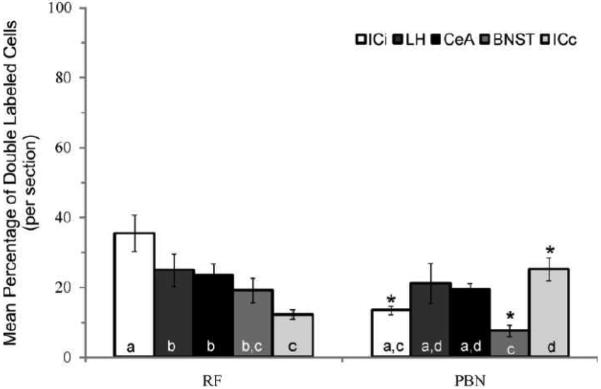
Fig. 8.
The mean incidence of tracer co-expression per section in ICi (n=49, 7.8 ± 0.2), LH (n=41, 7.0 ± 0.5), CeA (n=46, 7.7 ± 0.3), BNST (n=44, 7.3 ± 0.3), and ICc (n=43, 7.2 ± 0.7). The total number of sections as well as the mean number of sections per animal ± s.e. are indicated in parentheses. For each hindbrain injection site, statistical analyses are represented by letters where only those bars with the same letter are not statistically different at alpha < 0.05. *, statistical difference between RF and PBN.

