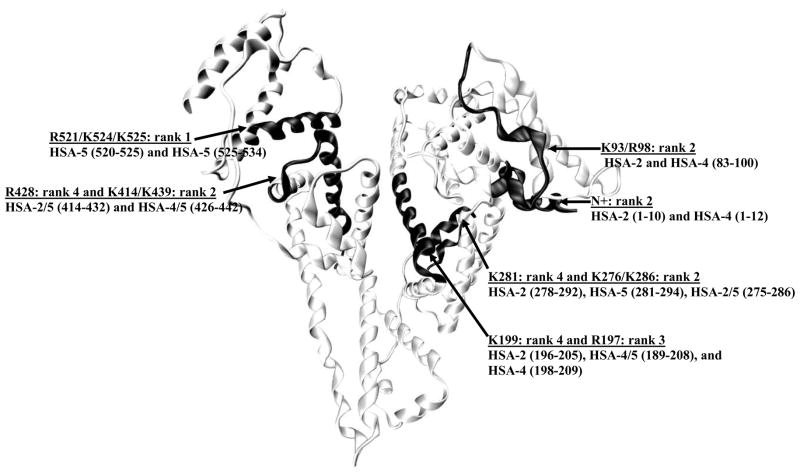
Figure 2.
Structure of HSA showing the most likely sites for glycation-related modifications, as based on a semi-quantitative comparison of the data obtained in this study. The regions that were found to have the highest levels of modification are highlighted. The amino acids that contained the highest amounts of modification within these regions are also shown.

