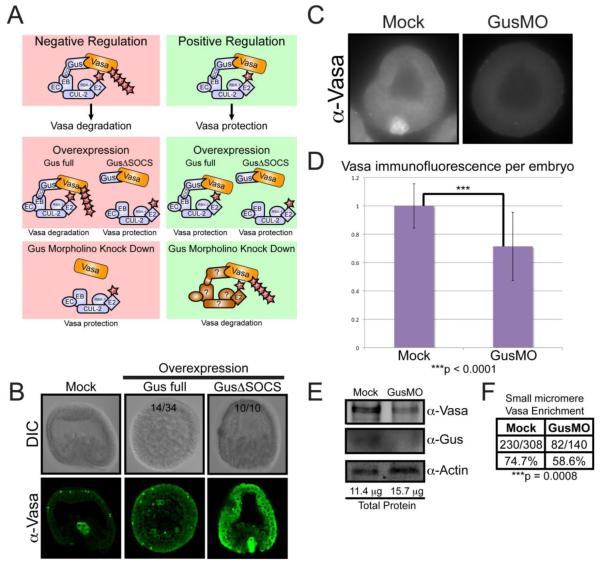
Figure 5. Gustavus is required for normal Vasa abundance and small micromere enrichment.
(A) Two hypothesis for how Gustavus function regulates Vasa protein stability. Negative Regulation: Gustavus targets Vasa for proteolysis through direct binding and ubiquitin conjugation. Overexpression of full-length Gustavus protein throughout the embryo would promote global Vasa proteolysis including the small micromeres, whereas overexpression of Gustavus lacking its SOCS-box would compete with endogenous Gustavus for Vasa binding, thereby protecting and elevating global Vasa protein levels. Morpholino knock down of endogenous Gustavus would remove any proteolysis targeting of Vasa resulting in elevated Vasa protein throughout the embryo. Positive Regulation: Gustavus interacts with Vasa and competes with other proteins that can target Vasa for proteolysis. Overexpression of full-length Gustavus or Gustavus lacking its SOCS-box throughout the embryo would both bind and protect Vasa, resulting in elevated Vasa levels throughout the embryo. Morpholino knock down of endogenous Gustavus would leave Vasa protein susceptible to proteolytic targeting by other Vasa-binding E3 ligase adapter proteins throughout the embryo resulting in a global reduction in Vasa protein. Gus: Gustavus, SOCS: SOCS-box, EB: Elongin B, EC: Elongin C Cul-2: Cullin 2, RBX1: RING Box Protein-1, E2: E2 ubiquitin conjugating enzyme, Ub: Ubiquitin (B) Immunofluorescence localization of endogenous Vasa in early gastrula embryos cultured in ASW following mock injection or injection with synthetic RNA containing a GusΔSOCS coding region (depicted in Figure 4A) or full-length Gus coding region. Numbers shown reflect representation within the resultant population, and Gus-full length was markedly more variable in the vasa phenotype. (C) Immunofluorescence of endogenous Vasa protein in 20 hour-old embryos either mock injected or treated with 500 μM GusMO. (D) Quantitative analysis of Vasa fluorescence per embryo. Error bars correspond to the fluorescence intensity standard deviation within the individual embryos assayed. The Vasa immunofluorescence difference between Mock (n = 76) and GusMO-injected embryos (n = 61), as calculated by a paired t-test, was statistically significant based on a two-tailed P value less than 0.0001. (E) Immunoblot analysis of protein extracts from mock and GusMO-injected embryos. A Bradford Assay calculated the total protein amount used for each sample. (F) The number of mock and GusMO-injected embryos displaying Vasa protein enrichment in the small micromeres, as observed by immunofluorescence. The difference in small micromere Vasa protein enrichment frequency between mock and GusMO embryos, as calculated using a Fisher’s Exact Test, was statistically significant (p < 0.0008) based on a two-tailed test.

