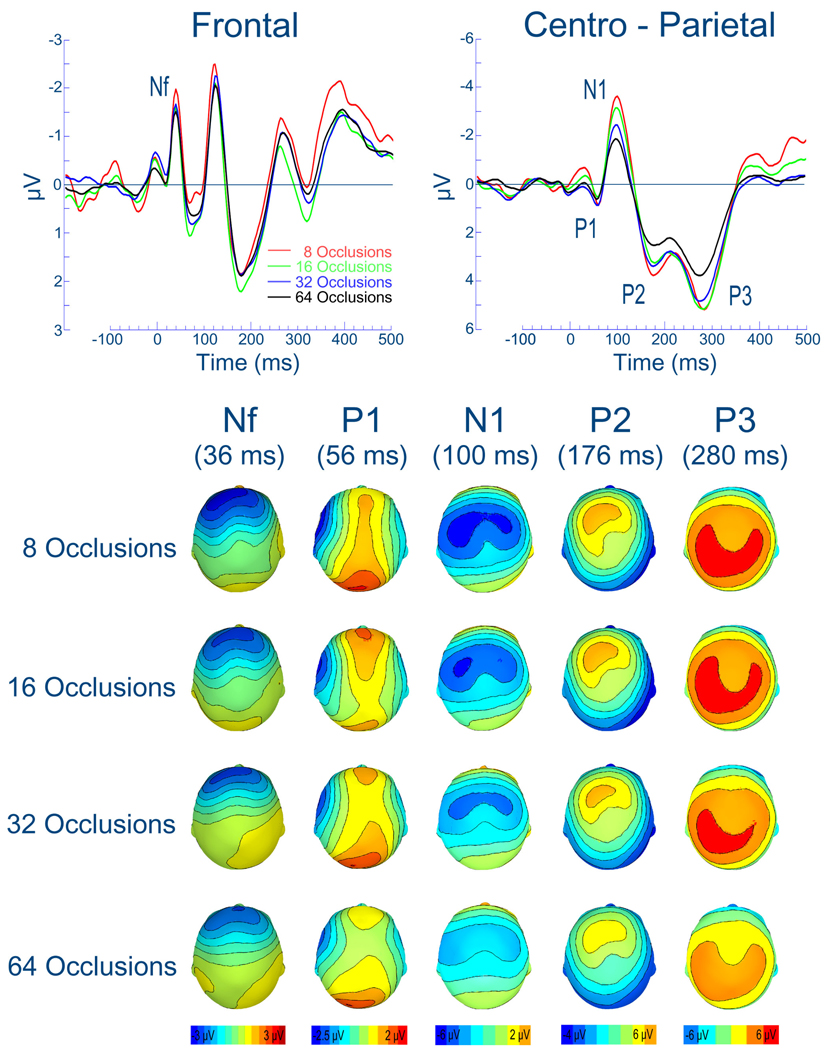
Figure 1.
Group mean respiratory-related evoked potential averaged across 8, 16, 32 and 64 inspiratory occlusions over the frontal and centro-parietal region (upper panel). Group mean scalp topography maps of the EEG voltage for the RREP components Nf, P1, N1, P2 and P3 (mapped at their peak latencies) averaged across 8, 16, 32 and 64 inspiratory occlusions (lower panel).

