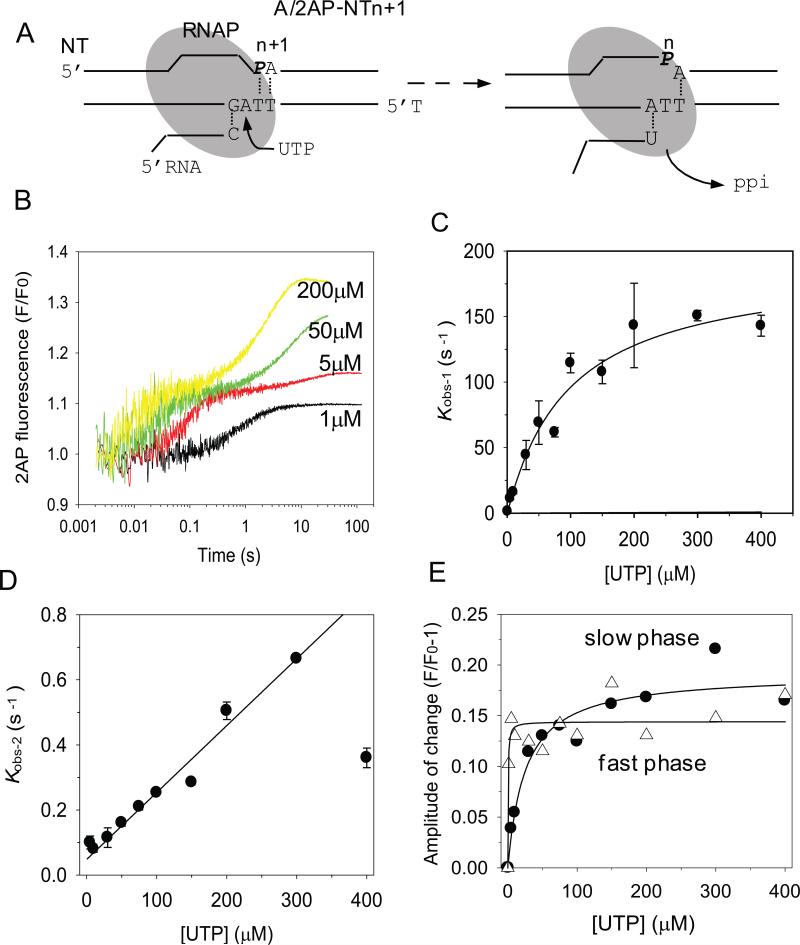
Fig. 4. Stopped-flow kinetics of multiple UMP incorporation.
(A) The A/2AP-NTn+1 contains 2AP in the NT strand at n+1 position and correctly base pairs with UTP. (B) Representative time traces of 2AP fluorescence changes upon adding UTP (1, 5, 50, and 200 μM, final concentrations) shows multiple kinetic phases. (C) The kobs-1 of the fast phase increases with [UTP] in a hyperbolic manner with kpol-1 = 192 ± 20 s-1 and Kd-1 = 98 ± 22 μM. Error bars indicate standard deviation from multiple measurements. (D) UTP concentration dependence of the slower phase, kobs-2 shows a linear dependence with slope = 0.002 μM-1s-1 representing kpol-2/Kd-2 ratio (D) UTP concentration dependence of the fast (open triangle) and slow phase (filled circle) amplitudes of 2AP fluorescence changes fit to the hyperbolic equation (Eq.2) with Kd,net = 0.3 μM for correct UMP:dA incorporation and Kd,net2 = 32 μM for UMP:dA misincorporation .

