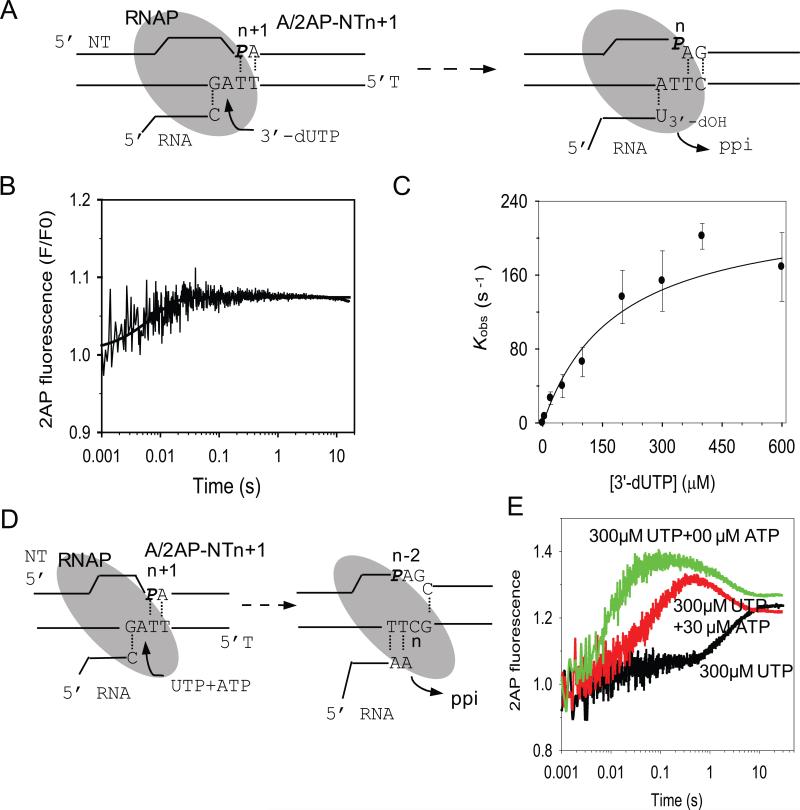
Fig. 5. Fluorescence measurements supporting the slow phase of UMP:dA misincorporation.
(A) Measurement of 3’-dUMP incorporation in A/2AP-NTn+1. (B) A representative time course of 2AP fluorescence change at 50 μM 3’-dUTP fits to a single exponential kobs = 39 s-1. (C) 3’-dUTP concentration dependence of kobs fits to a hyperbola with kpol = 235 ± 28 s-1 and Kd = 185 ± 64 μM. Error bars encompass the high and low values from duplicate measurements. (D) Measurement of successive UMP and AMP incorporation in A/2AP-NTn+1. (E) Representative time traces show multiple 2AP fluorescence changes with 300μM UTP alone (black trace), UTP + 30μM ATP (red trace), and UTP + 300 μM ATP (green trace).

