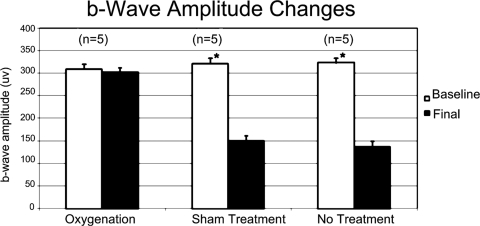
Figure 3.
Graph shows the amplitude changes of the scotopic b-wave comparing the initial baseline normal readings with the final readings at 2 weeks. Error bars represent 1 SD. Statistically significant difference exists between the baseline and the final values for the sham treatment and the no treatment groups, whereas no statistically significant difference exists for the oxygenation group. *P < 0.05.

