Figure 5.
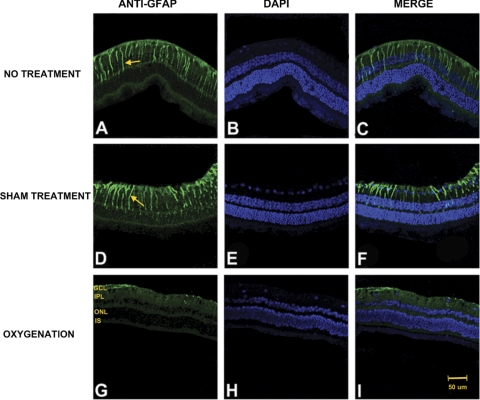
Photomicrographs of vertical retinal sections from standardized regions (4 disc diameters below the optic disc) in the retina processed for anti-GFAP immunofluorescence (A, D, G) with DAPI nuclear counterstain shown in images (B, E, H) and merged images (C, F, I). The secondary antibody was FITC-conjugated anti-mouse IgG. High expression of GFAP was shown in both the no treatment (A) and the sham treatment (D) groups compared with the oxygenation group (G). GCL, ganglion cell layer; IPL, inner plexiform layer; ONL, outer nuclear layer; IS, inner segments of the photoreceptor layer. Arrows: areas representative of Müller cells with increased GFAP expression. Scale bar, 50 μm.

