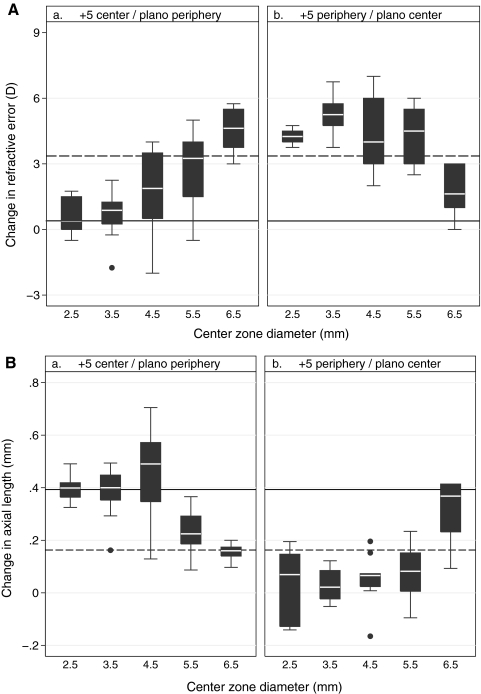
Figure 1.
Boxplots of central refractive error changes (a and b, top), and corresponding axial length changes (a and b, bottom) over the treatment period for (a) the +5C lens designs and (b) the +5P lens designs. Central zone diameters (CZD, on X-axis) ranged from 2.5 to 6.5 mm. Dashed reference lines: mean changes induced by +5SV lens; solid lines: mean change induced by the plano lens. Whisker length denotes the shorter of 1.5 times the interquartile range and the distance to the extreme.

