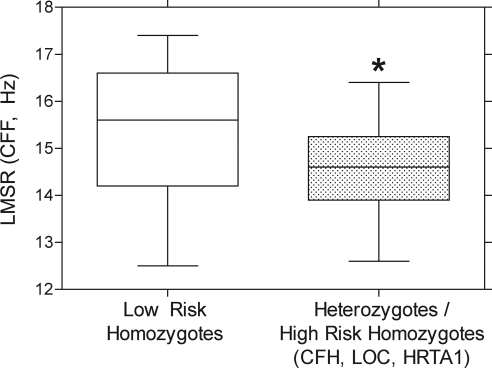
Figure 2.
Mean LMSR CFF values for participants who were heterozygous and homozygous for high-risk CFH, LOC, and HRTA1 SNPs are significantly lower compared with the gene-negative participants (asterisk). Box-and-whiskers plot shows the median (50th percentile), interquartile range (25th–75th percentile), and highest and lowest values.

