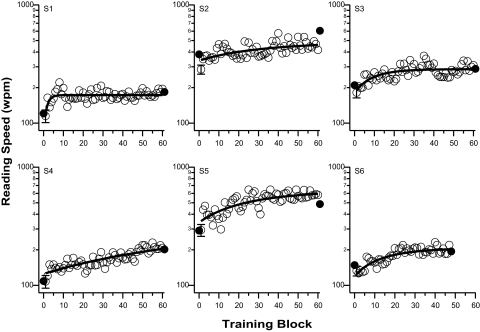
Figure 1.
Reading speed (wpm) is plotted as a function of training blocks for the six observers. Filled symbols represent the maximum reading speed obtained at pre- and post-tests (not included in the fitting of the exponential function). In each panel, the solid line represents the best-fit exponential function to all the training blocks. To avoid clutter, only one set of error bars is plotted in each panel (plotted at block 1), representing the averaged SEM across the 60 blocks of trials.

