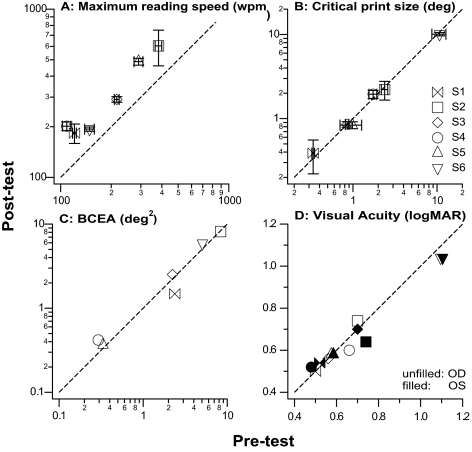
Figure 3.
Post-test values are compared with pre-test values for (A) maximum reading speed (wpm), (B) critical print size (deg), (C) BCEA (deg2), and (D) visual acuity (logMAR). Each symbol represents one observer except for (D), where each symbol represents one eye of each observer. Dashed line is the 1:1 line, representing no change in the value after training. (D) Acuities for the right (unfilled symbols) and left (filled symbols) eyes are plotted separately. For observers S5 and S6, the acuities and the changes after training were identical for both the right and left eyes. To avoid clutter, these data points (upward-pointing and downward-pointing triangles) are slightly shifted along the abscissa.

