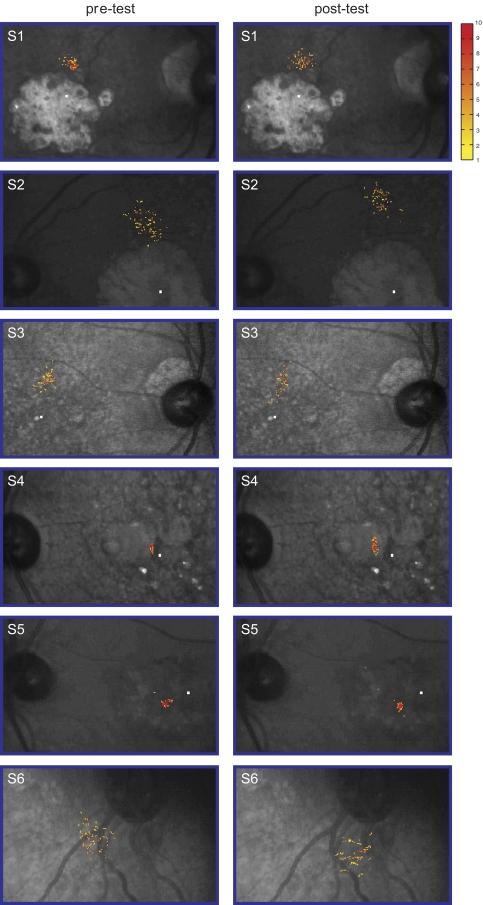
Figure 4.
The frequency distribution of the retinal locations used for fixation is superimposed on the fundus picture of each observer, before (pre-test) and after (post-test) training. The absolute number of fixation for each location is coded by color, with the key given on the right. The frequency distribution in each panel was based on one trial, randomly selected among the three repeated testings for the same condition, for each observer. The small white rectangle in each picture (except for S6) represents the location of the anatomical fovea.

