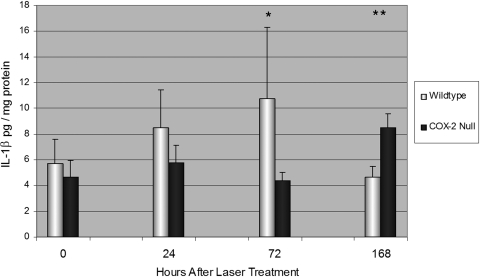
Figure 6.
Mean IL-1β concentration in the retina and RPE-choroid in unlasered mice (time 0) and at 24, 72, and 108 hours after LCNV. IL-1β concentration was greater in WT than in COX-2 null mice at 24 (P = 0.15) and 72 hours (P < 0.05) but became significantly less at 168 hours (P < 0.01). Error bars are in SD. Total numbers of mice per group were as follows: time 0, 6 WT and 6 COX-2; time 24, 11 WT and 11 COX-2; time 72, 5 WT and 5 COX-2; and time 168, 5 WT and 5 COX-2. *P < 0.05. **P < 0.01.

