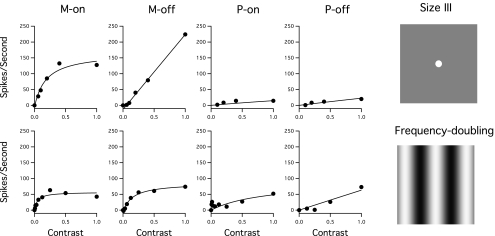
Figure 3.
Contrast responses for the size III stimulus (top) and the frequency-doubling stimulus (bottom) for the same cells illustrated in Figures 1 and 2. Circles: spike rates for different contrasts. Curves: Michaelis-Menten functions fit to the data. For consistency between stimuli, data are shown only up to 100% stimulus contrast. Right: size III and frequency-doubling stimuli.

