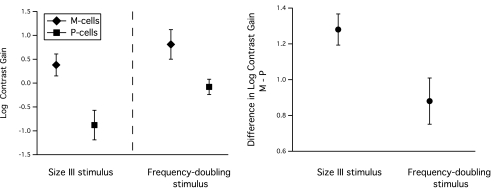
Figure 4.
Left: mean contrast gain for size III and frequency-doubling stimuli, for M and P cells. SD (error bars) was similar for all four types of contrast gain. Right: mean (± SE) differences in log contrast gain for M cells minus P cells, for size III and frequency-doubling stimuli. The difference was significantly larger for the size III stimulus than for the frequency-doubling stimulus, and the size III stimulus was superior to the frequency-doubling stimulus in preferentially stimulating M cells.

