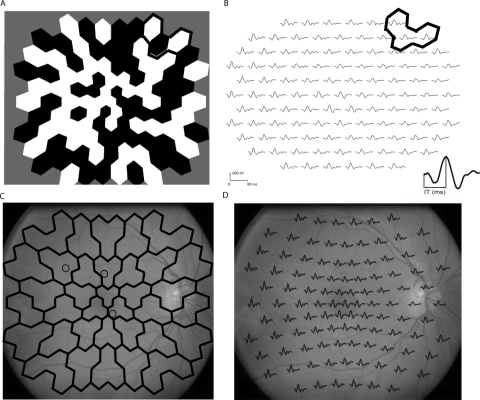
Figure 1.
(A) mfERG array with a sample three-hexagon zone highlighted. (B) Array results in 103 mfERG traces, grouped by zone. A sample zone is again shown. The inset waveform shows the measurement of the P1 implicit time. (C) Zones were also overlaid over fundus photographs to determine which zones had retinopathy. Circles: the locations where the retinopathy has developed. (D) The same photograph of one of our type 1 patients with the mfERG trace array overlaid.

