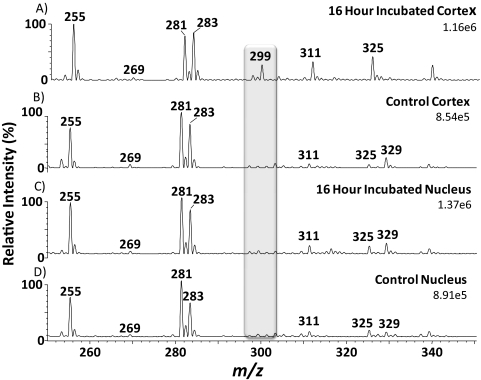
Figure 3.
Negative ion mass spectra of control lenses and lenses incubated with 13C18-oleic acid. (A) Cortex incubated with 13C18-oleic acid for 16 hours, (B) control cortex, (C) nucleus incubated with 13C18-oleic acid for 16 hours, (D) control nucleus. Shaded region: illustrates the position of 13C18-oleic acid at m/z 299.5.

