Figure 6.
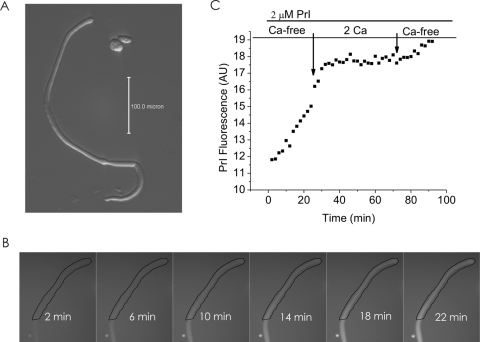
Dye uptake in a differentiating fiber cell isolated from the lens of a knockout Cx50 mouse. (A) Hoffmann image of the fiber cell used in the dye uptake experiment. (B) PrI images at different time points of a time-lapse recording. The cell was exposed to PrI (2 μM) starting at time 0. (C) Dye uptake was decreased by raising [Ca2+]o. To measure changes in the rate of dye uptake over time, the integrated fluorescence intensity from the ROI shown in (B) is plotted as a function of time in arbitrary units (a.u.). The cell was initially bathed in nominally divalent cation-free solution. At the time indicated by the first arrow, the cell was exposed to a solution containing 2 mM [Ca2+]o. Calcium was washed out at the time indicated by the second arrow. All the solutions contained PrI (2μM).

