After optic nerve infarct, cholinergic amacrine cells downregulate their neurotransmitter, but unlike retinal ganglion cells, do not die. Amacrine cell death occurs only when there is associated inter-retinal stress.
Abstract
Purpose.
Displaced cholinergic amacrine cell neurons comprise a significant fraction of the retinal ganglion cell (RGC) layer. Rodent anterior ischemic optic neuropathy (rAION) is an optic nerve infarct, which results in RGC loss in mice. The goal was to determine whether rAION produces changes in amacrine cell neurons.
Methods.
rAION was generated in transgenic mice carrying a cyan fluorescent reporter protein (CFP) gene linked to the Thy-1 promoter, which expresses CFP in RGCs. rAION was induced with standard parameters. Retinas were examined pre-and post-induction by retinal fundus microscopy. rAION induction severity was scored by changes in retinal transparency and RGC loss. Cholinergic amacrine cells were identified via choline acetyltransferase (ChAT) immunohistochemistry. ChAT and CFP expression was evaluated in flat-mounted retinas examined by confocal microscopy and western analysis.
Results.
Moderate rAION induction levels (defined as early retention of retinal transparency and <70% RGC loss) did not alter amacrine cell numbers in the RGC layer, but changed the relative levels of ChAT expression by immunohistochemistry. No changes in total ChAT protein were seen. Severe rAION induction (defined as loss of retinal transparency and >70% RGC loss) resulted in a trend toward amacrine cell loss and decreased ChAT protein levels.
Conclusions.
There is wide disparity in mouse rAION induction levels using standardized parameters. Moderate rAION induction levels without direct retinal compromise produces isolated RGC loss, with displaced amacrine cell changes likely due to changes in RGC-amacrine communication. Severe rAION induction results in both RGC and amacrine cell loss, possibly due to intra-retinal ischemic changes.
Amacrine cell neurons are retinal interneurons which process bipolar-neuron based signals via axo-dendritic synapses on retinal ganglion cell (RGC) neurons.1 Processed signals are sent via RGC axons in the optic nerve to higher CNS structures. Trauma, ischemia, and glaucomatous ON damage result in retrograde RGC loss. However, the fate of amacrine cells after RGC damage and loss is less clear. In part, this is because of the varied nature of amacrine cells, which comprise at least 24 different subtypes, as documented by various cell markers.1 A previous study evaluating amacrine cells after retinal ischemia/reperfusion revealed a pattern of complicated gene and protein expression responses by different amacrine cell subpopulations.2,3 One amacrine neuron type, Starburst amacrine cells, are cholinergic neurons, which comprise nearly 75% of all amacrine cells in the mouse retina,4,5 and are a major component of the displaced amacrine cell population found in the retinal ganglion cell layer.5
We previously demonstrated RGC loss after a model of clinical NAION in rats,6,7 mice,8 and monkeys.9 However, while retinal interneuron cell gene expression changes are known to occur in ON crush10 and diabetic retinopathy,11 amacrine neuronal alterations after an optic nerve stroke (nonarteritic anterior ischemic optic neuropathy) are unknown.
The Thy1-CFP (B6.Cg-Tg[Thy1-CFP]23Jrs/J) transgenic mouse line incorporates the Thy-1 promotor coupled to cyan fluorescent protein (CFP) reporter protein (Thy 1-CFP(+)),12 and has been used to identify and quantify RGC numbers after rAION induction,13 in models of glaucoma,14 and has been recently evaluated in terms of amacrine expression of various neurotransmitters.15 Using a Thy1-CFP transgenic mouse strain, we evaluated the effect of the current rodent NAION model (rAION) on cholinergic amacrine cells and quantified the relative effects of mild and severe inductions on numbers of these cells, compared with RGC numbers, at one month post-stroke.
Materials and Methods
Mouse Strains
All animal protocols were approved by the University Institutional Animal Use and Care (IACUC) committee, and followed the recommendations and adhered to the ARVO Statement for the Use of Animals in Ophthalmic and Vision Research. B6.Cg-Tg (Thy1-CFP)23Jrs/J (CFP +) transgenic mice were obtained from Jackson Laboratories (Bar Harbor, ME), and a transgenic line with a β-galactosidase (β-Gal) reporter gene linked to the cfos early immediate gene promoter16 and back-crossed into CD-1 mice obtained from the same source for >10 generations. Animals were given food and water ad libitum. Genotyping was performed from tail snips, using the appropriate PCR primers as previously reported.13
rAION Induction
rAION was induced in anesthetized animals as previously described.8 Briefly, Rose Bengal (2.5 mM in phosphate-buffered saline [PBS], 1 mL/kg) is administered intravenously, and the optic nerve of the treated eye illuminated with a 535 nM wavelength, 300 μM laser spot (Iridex Corp, Mountain City, CA) for 12 seconds, using a fundus contact lens. The left eye of each animal was left untreated as an internal control. Retinas and ON were photographed 3 days post-induction.
Ex Vivo Retinal Immunostaining and Stereology
After post-induction analysis, animals were allowed to recover for 30 days, and euthanatized. Eyes were post-fixed overnight in 4% paraformaldehyde-phosphate buffered saline (pH 7.4). Whole retinas were excised, cut in cloverleaf pattern, and incubated in hyaluronidase (Wydase; Wyeth Pharmaceuticals, Collegeville, PA) at 1:1000 in PBS for 1 hour before further tissue preparation, to remove excess vitreous material. Retinas were immunostained using apolyclonal rabbit antibody for choline acetyltransferase (ChAT; Santa Cruz Chemicals, Santa Cruz, CA), goat antiBex-1/2 (kind gift of Frank Margolis), mouse anti-beta galactosidase (β-Gal). C3- and C5-labeled donkey anti-rabbit, goat, or mouse secondary antibodies (1:2000) were used, after the permeabilization procedure previously reported for Brn 3a RGC immunostaining.7 CFP-RGC visualization was performed using a confocal microscope with a 405 nm exciting laser. Z-stack (tissue depth) sections of the different retinal regions were made to analyze patterns of both displaced amacrine cells in the RGC layer, and deeper in the inner nuclear layer. DAPI was used to image non-CFP transgenic nuclei. Because DAPI emission excites the CFP fluorescent protein, we used DNA dye Topro-3, Invitrogen, Carlsbad, CA) to image the nuclei of CFP transgenic animal retinas.
Stereological analyses of the retinas of contralateral (control) eyes included both RGC-regional density and total CFP(+) RGCs/retina, using a random-number matrix that provided randomization for both retinal angle and distance from the optic nerve. Estimated total CFP(+) cells were based on the total retinal area measured from each retina. For counting, a 10× objective was used with a ×5.5 digital magnification, enabling analysis of approximately 100 cells per field. A minimum of 800 cells were counted per retina, which is greater than the number required by the Schmitz-Hof equation17,18 for statistical validity. This equation is based on the ‘fractionator’ method of determining the minimum number of randomly selected neurons (or other cells) required to be counted in a given solid tissue volume containing n cells, to obtain a statistically valid estimate of total cell number, when the total volume v is known, without the necessity of counting every cell in the sample tissue. Earlier estimates of the required number of randomly selected suggested ∼150 cells were sufficient.19 However, the current recommendation is a minimum of 700 to 1000 neurons/sample to ensure that the predicted coefficient of error is <0.05.17
Results
Displaced ChAT(+) Amacrine Cells in the RGC Layer of CFP Mice
ChAT immunostaining in a control retinal cross-section of Thy 1-CFP(+) mice reveals the typical pattern of ChAT(+) cells in both the innermost layer of the inner nuclear layer (INL), as well as ChAT(+) cells in the RGC layer (Fig. 1B). Thy 1-CFP(+) cells are early distinguishable only in the RGC layer (Fig. 1A). Displaced ChAT(+) amacrine cells comprise roughly 40% of all cells in the RGC layer of Thy-1 (CFP) mice (Fig. 1B; arrows), while CFP(+) cells and ChAT(+) cells are largely distinct populations within this layer (Fig. 1C; arrows). Two ChAT(+) synaptic sublayers are apparent within the inner plexiform layer (IPL; Fig. 1B, arrowheads). While a few CFP(+) cells are also ChAT(+) (data not shown in Fig. 1), the majority of cell bodies with ChAT immunolocalization in the RGC layer are distinct from CFP(+) cells.
Figure 1.
Retinal expression of CFP and ChAT in Thy-1 (CFP) control retinas. (A) ChAT(+) immunostaining. ChAT(+) cells (red) are present in both the RGC and INL layers (1A, arrows). There are two ChAT(+) synaptic layers within the IPL (arrowheads). (B) Retinal CFP expression in a control retina cross-section. Cellular CFP (green) expression is limited to the RGC layer. (C) Merged images. There is little overlap of cells strongly expressing both labels. OPL, outer plexiform layer; ONL, outer nuclear layer. Scale bar, 100 μm.
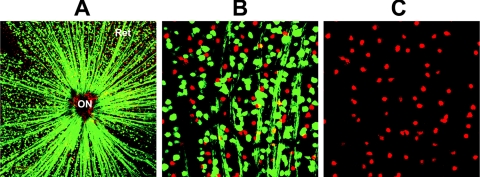
To further address the issue of whether the majority of displaced amacrine cells in the RGC layer of the Thy-1-CFP(+) transgenic mouse strain are also CFP(+), we immunostained a flat-mounted retina (Fig. 2). CFP(+) cells are apparently evenly distributed throughout the RGC layer of the retina (Ret), with their CFP(+) axons converging on the optic nerve (ON).13 Nearly all ChAT(+) cells do not co-localize with CFP (compare cell distribution of both cell types in Fig. 2B), and are also relatively evenly distributed throughout the RGC layer in this retinal region. There is also strong ChAT(+) immunopositivity in the most cells that react with this antibody in the RGC layer of control retinas. Thus, the vast majority of amacrine cells in the RGC layer that express ChAT, do not express CFP, or express it only very weakly.
Figure 2.
CFP(+) and ChAT(+) expression in the RGC layer in a transgenic Thy 1-CFP(+) control retina. (A) Composite confocal low power picture showing the flat-mounted retina from a Thy 1-CFP(+) transgenic mouse immunostained for ChAT. CFP(+) cells (green) are distributed throughout the retina (Ret). CFP(+) axons converge on the optic nerve (ON). ChAT(+) cells (red) are also identifiable. (B) High power composite confocal view of the same retina. ChAT(+) immunopositive cells are evenly distributed within the same layer as CFP(+) cells. There is little overlap of the CFP and ChAT signals. (C) Isolated ChAT(+) expression in the same retinal section. ChAT(+) expression signal is equivalent in the majority of ChAT(+) cells, with apparently even distribution.
Early rAION-Associated Stress in ChAT(+) Amacrine Neurons
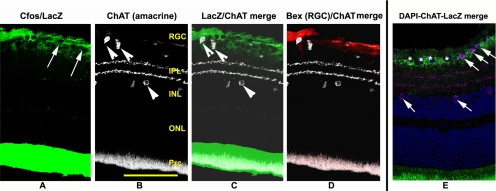
Previous reports suggested that direct retinal ischemia (IOPs to 60 mm for 1 hour) results in amacrine cell stress and selective cell loss.2,3 We previously determined that cfos expression was detectable in RGCs 1 day post-induction, using a transgenic mouse line with the reporter protein β-Galactosidase (LacZ) linked to a promoter for cfos, an early stress-related protein.8 Cells undergoing stress thus express immunohistochemically detectable levels of β-gal. ChAT- and β-gal immunohistochemical analysis 1 day post-induction of moderate rAION reveals that ChAT(+) cells in the RGC layer express β-gal weakly, if at all (Fig. 3). ChAT(+) cells in the INL are β-gal(–) (Fig. 3). In contrast, LacZ expression co-localizes with expression of Bex 1/2; an RGC-expressed protein.20 These results suggest that moderate rAION induction does not result in significant early ChAT neuron stress in either the RGC- or INL layers.
Figure 3.
ChAT(+) cells in the RGC and INL layers do not express lacZ 1d post-induction of moderate rAION. A retina from a transgenic mouse line with the cfos-lacZ construct was induced to a moderate level with rAION. One day post-induction, the retina was analyzed for ChAT and LacZ (β-gal) expression. (A) Cfos/LacZ expression. LacZ expression (green) is restricted to the RGC layer. RGC-layer nuclei are detectable as black holes in the RGC layer (arrows). (B) ChAT expression. ChAT(+) cells (white) are identifiable in the RGC and IN layers (arrowheads), with two ChAT(+) synaptic layers in the IPL. (C) LacZ/ChAT merged image. ChAT(+) cells do not co-localize with LacZ expression in either the RGC- or IN layers. (D) ChAT and Bex 1/2 expression. Bex 1/2 (an RGC-specific protein: red) does not co-localize with ChAT cells, but rather with the β-gal associated regions. (E) DAPI/ChAT/LacZ expression. There is minimal, if any lacZ expression (green) associated with RGC layer ChAT(+) (purple) cells, and absence of LacZ expression in ChAT(+) cells in the INL (arrows). Nuclei in the RGC layer are detectable by DAPI (blue). Prc: photoreceptor layer. Scale bar, 100 μm.
CFP and ChAT Expression Changes after rAION
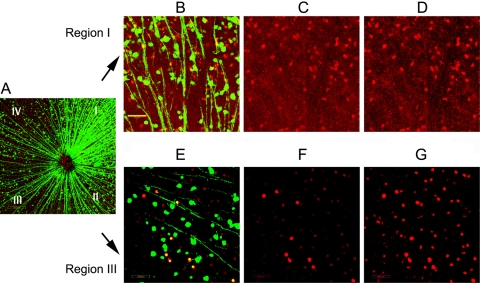
We evaluated the relative expression of CFP and ChAT immuno-positivity 30 days after rAION induction. We previously determined that there is an easily detectable loss of CFP(+) expression in affected retinal regions by 12 days post-induction (Bernstein SL, unpublished data, 2005). In CFP(+) mice 30 days post-rAION, there is regional RGC loss detectable by loss of CFP expression,8 and in another rodent species (the rat), RGC loss by Bex-1/2 immunostaining, retrograde fluorogold label, and Brn3a flat-mount ex-vivo immunostaining is essentially complete by 30 days post-induction.7 We evaluated both regional CFP expression and ChAT immunopositivity in the RGC layer and INL in CFP transgenic animals by confocal microscopy. There was a regional loss of CFP(+) cells in the RGC layer of induced eyes, demonstrable by confocal microscopy (Fig. 4A). We arbitrarily divided flat-mounted retinas into four quadrants (I–IV); (Fig. 4A).
Figure 4.
Changes in CFP and ChAT expression in the RGC layer of transgenic animals 30 days after rAION. Roman numerals indicate the different retinal regions divided into quadrants. (A) Merged confocal low power magnification of flat-mounted retina of a transgenic mouse 30 days post-rAION. There is regional loss of CFP(+) cells (green) that is most easily seen in quadrants II–IV. Regional RGC axonal loss is also apparent in these zones, as they converge toward the optic nerve (ON). (B–D) Changes in CFP and ChAT(+) cells in a high magnification image of quadrant I. (B) Merged image. Despite the relatively intact appearance of this quadrant seen in (A), there appears to be a loss of CFP(+) cells. Scale bar, 50 μm. (C) ChAT expression in region I. ChAT(+) cells are seen in red. (D) Enhanced signal intensity of ChAT expression in region I. A similar number of ChAT(+) cells and distribution are apparent in retinal region I. Increasing the laser signal intensity does not change the distribution or relative intensity. (E) Merged confocal image of region III. There is a loss of CFP(+) cells and axons, with fewer visible ChAT(+) cells. (F) ChAT expression in region III. Fewer ChAT(+) cells are visible. (G) Enhanced signal intensity of ChAT expression in region III. Increased ChAT(+) cell numbers are now apparent by increasing the laser signal intensity, suggesting that there is a downregulation of ChAT activity in many cells after RGC loss.
In Figure 4, the majority of CFP(+) cell loss is visible in quadrants II–IV, while quadrant 1 has preservation of both CFP(+) axons and cell bodies (Fig. 4A). At higher magnification, quadrant 1 has numerous distinct individual CFP(+) axons and cells (Fig. 4B). Confocal ChAT(+) immunolocalization in the RGC layer reveals numerous ChAT(+) cells (Fig. 4C). Increasing the exciting laser power in the ChAT channel does not increase the apparent number of cells, (Fig. 4D), suggesting that in region where RGC numbers are relatively unaffected by rAION, the number of ChAT(+) cells is similar to that seen in control retinas, and the relative level of ChAT protein is similar to control retinas.
In comparison with region I, loss of CFP(+) activity is easily distinguishable in region III (Fig. 4A). At higher magnification, there is a loss of individual CFP(+) axons and cell bodies (Fig. 4E). At identical confocal laser power detection levels used to evaluate control retinas, there is an apparent loss of ChAT(+) cells in quadrant III (Fig. 4F). However, increasing the exciting laser intensity used to detect ChAT(+) immunoreactivity results in detection of many more cells with reduced ChAT expression, with a distribution pattern and quantification similar to that detectable in control retinas (Fig. 4G). Thus, rAION likely results in downregulation of ChAT expression in amacrine cell neurons in the RGC layer of rAION-affected retinal regions.
Loss of CFP(+) Cell Nuclei in Moderate rAION.
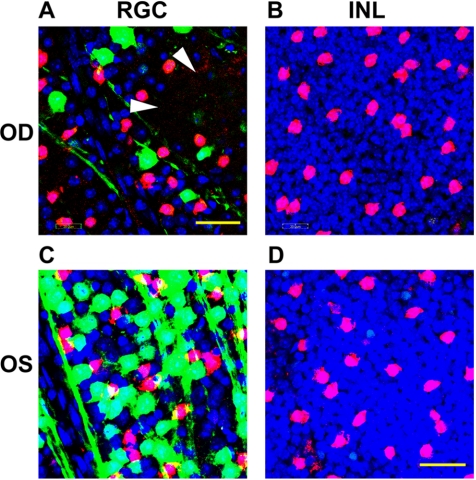
Previous reports suggest that in mouse glaucomatous ischemic optic neuropathy, there may be RGC-specific protein downregulation without cell soma loss.21,22 We evaluated rAION-associated cell loss by co-localizing a DNA-selective dye (Topro-3) with CFP and ChAT immuno-localization (Fig. 5). Two patterns of DNA-selective dye staining were seen: loss of Topro-3 positive nuclei (arrowheads, Fig. 5A) in rAION-induced retinas, and a reduction in the size and intensity of some of the remaining Topro-3(+) cell bodies (compare Fig. 5A; rAION-induced retina, with Fig. 5C; control retina), which were CFP(–). The average number of ChAT(+) cells remained relatively unchanged between rAION-induced and control retinas in the RGC layer and INL (compare Figs. 5A and 5C, with Figs. 5B and 5D). Similarly, there were no detectable differences in the number of ChAT(+) immunopositive cells in the INL, or alteration in Topro-3 nuclear staining.
Figure 5.
Changes in nuclear staining after rAION. Twenty-one days post-rAION induction, CFP(+) retinas of either induced (OD; A and B) or naïve (OS; C and D) were immunostained with ChAT (red) and counterstained with Topro-3 (blue). Analysis of Topro-3 stained nuclei in the RGC layer (A and C) and the INL (B and D) are shown. (A) RGC layer, rAION-induced. There is a relative loss of CFP(+) cells (green) in the rAION-induced retina, without loss of ChAT(+) cells. Topro-3 staining is reduced, with areas of dropout (arrowheads), suggesting cell loss. (B) INL layer, rAION induced. No loss of nuclei or change in ChAT(+) immunostaining is detectable in the INL. (C) RGC layer, control retina. There are large numbers of CFP(+) and ChAT(+) cells, and Topro-3(+) nuclei. (D) INL layer, control retina. The Topro-3 activity and ChA(+) immunopositivity is identical with that seen in moderately induced rAION retinas.
Loss of Amacrine Cell Neurons in Severe rAION-Induced Transgenic Animals.
Mouse ON vascularization is extremely variable,8,23 and rAION severity levels can vary significantly, despite identical induction parameters. A 12-second laser induction time in mice results in a statistically significant average 64.3 ± 17% loss of Thy 1-CFP(+) cells in the RGC layer (compare CFP(+) numbers in control and rAION-induced retinas; Fig. 6A). There was a trend toward ChAT(+) amacrine cell loss in the rAION induced group, versus control retinas (24.4±38.9%), that was not statistically significant (Fig. 6A).
Figure 6.
Total changes in CFP and ChAT(+) cells after all rAION inductions. Control cell numbers are shown as dark bars, and experimental cell numbers are seen as white bars. (A) Cell counts of all retinas (n = 9 animals). There is a 64.3 ± 17% average CFP(+) cell loss 30 days post-rAION (P < 0.05), with a 24.4 ± 38.9% loss of ChAT(+) cells, (nonstatistically significant), in the same layer (P < 0.5). (B) Changes in CFP and ChAT(+) cells after moderate rAION induction. There is a 47.0 ± 3.0% CFP(+) cell loss, with no trend in ChAT cell numbers (102.5 ± 18% of control) 30 days post-rAION induction. (C) Changes in CFP and ChAT(+) cells after severe rAION induction. In transgenic mice with severe rAION (average 79.0 ± 4.2% CFP(+) cell loss), there was a greater (48.5 ± 30.8%) but still nonstatistically significant trend (P < 0.215) toward loss of ChAT(+) cells. Double asterisks indicate statistical significance (two-tailed t test, P < 0.05).
To further evaluate the changes in ChAT(+) cells after rAION induction, we re-analyzed the nine mice retinas used for the total CFP/ChAT stereological analysis (Fig. 6A) and sub-grouped all retinas into two groups: mild-moderate RGC loss (<70% CFP(+) cell loss; Fig. 6B; n = 4), and severe (>70% CFP(+) cell loss; Fig. 6C; n = 5), and evaluated ChAT(+) cell loss in these two sub-groups. Control cell numbers are shown by the dark bars, while experimental cell numbers are shown by the white bars. In the mild-moderate rAION induction group, there was a statistically significant average loss of (47.0 ± 3.0%) CFP(+) cells (Fig. 6B). No changes were seen in ChAT(+) cell numbers in this group of retinas (102.5 ± 18% of control; Fig. 6B). In contrast, rAION-induced retinas with severe RGC loss (79.0 ± 4.2% statistically significant, P < 0.001; Fig. 6C) exhibited a much larger (48.5 ± 30.8%), but still nonstatistically significant loss in ChAT(+) cells in the RGC layer (Fig. 6C).
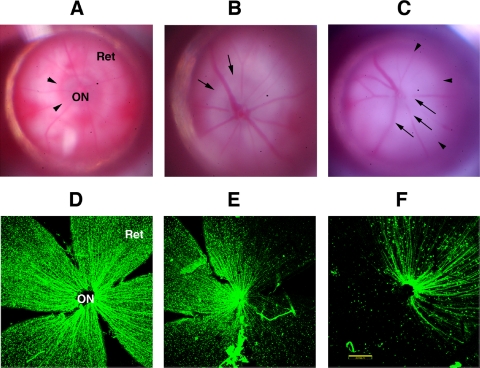
We evaluated the retinal fundi of all rAION-induced animals, using the same contact lens used to induce rAION, and correlated this with Thy 1-CFP(+) cell loss. These results are shown on Figure 7. The retinas of control Thy 1-CFP(+) mice on a CD1 genetic background have a grayish-translucent optic nerve (Fig. 7A; ON), with a reddish halo of vascularization around the ON. Under 405 nm excitation, a flat-mount retina reveals an RGC layer with a ‘starry sky’ cellular appearance, with a radial pattern of axons that converge on the ON. Mild-moderate inductions result in a whitening of the optic nerve, without necessarily resulting in visible ON edema (Fig. 7B), unlike the ON edema typically seen in rat retinas with the same induction conditions.6 There is also a loss of the reddish ring around the ON seen in control retinas (arrows, Fig. 7B). These rAION inductions result in a regional loss of CFP(+) cells (Fig. 7E), with a loss of the radial symmetric pattern of axonal convergence on the ON.
Figure 7.
Variation in stroke severity-numbers (A–C): Gross fundus appearance of rat retinas. (A) Control (uninduced) retina. The optic nerve (ON) is grayish, with a reddish surrounding flush of peripapillary choroidal blood circulation (arrowheads). The retina (Ret) is transparent. (B) Moderate induction 2 d post-rAION. There is ON edema and blanching (arrows). (C) Severe induction 2 d post-rAION. The retina has become somewhat edematous, with obliteration of the ON structure and masking of the retinal vessels, but no vascular dropout is seen. (D–F): CFP expression in flat-mount of the same transgenic retinas seen in (A–C). (D) Control retina. There is no loss of CFP(+) cells, with a uniform ‘starry sky’ appearance and symmetrical distribution of axons around the ON. (E) CFP(+) expression after moderate rAION induction. Significant regional loss of CFP(+) cells is seen in roughly 40–50% of the retina. (F) CFP(+) expression after severe rAION induction. While there is a preferential regional CFP(+) cell loss, CFP(+) cell- and axon loss are apparent throughout the retina. Scale bar: 200 μm.
rAION inductions producing significant retinal whitening/edema, with blurring and obscuration of the retinal vasculature near the ON, and further out in the retina (Fig. 7C, arrows), also resulted in >70% CFP(+) cell loss in the RGC layer (Fig. 7F). There was also a large area of ON whitening (Fig. 7C; arrowheads), with blurring and obscuration of the intraretinal vasculature near the ON (Fig. 7C, arrows).
While there is clearly regional loss of CFP(+) RGCs in both moderate and severe rAION inductions, we did not correlate the precise region (nasal versus temporal, superior versus inferior) of this occurrence.
Correlation of ChAT and Brn3a Expression in Moderate and Severe rAION-Induction
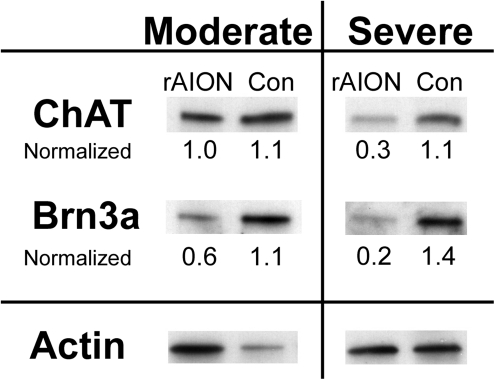
To independently confirm whether the level of rAION induction severity alters ChAT expression, we performed western analysis for total retinal ChAT and Brn3a (a POU domain protein expressed, in the retina, exclusively in RGCs).24,25 rAION was induced in one retina of each animal and evaluated two days post-induction for extent of severity. The contralateral eye was left as naïve control. rAION induction was classified as moderate or severe as previously indicated (see Fig. 7A–C). Total retinal protein from each eye was isolated 21 days post-induction, and ChAT, Brn3a, and actin expression were monitored using specific antibodies. Results are shown in Figure 8.
Figure 8.
Western blot analysis of ChAT and Brn3a protein in rAION-induced and control retinas. rAION was induced to either a moderate or severe level (defined as the level of retinal opacification; see Fig. 7). Total Retinal protein was isolated from individual retinas from induced (rAION) and control (Con) and western analysis performed after transfer of PAGE-separated protein homogenates. Band densities quantified and normalized using Actin loading controls for each retina. ChAT protein levels remain relatively constant after moderate rAION-induction, but show a decrease in severe rAION-induced eyes.
There is a decrease in Brn3a protein levels in both moderate and severe rAION-induced eyes (Fig. 8), compared with control. The moderately-induced retina showed a 40% loss of Brn3a protein signal, compared with the contralateral control eye of the same animal. In contrast, there was little decrease in ChAT protein level in the protein homogenate of the same eye, compared with control. After severe rAION induction, Brn3a protein levels declined to 14% (0.2/1.4) of control, while ChAT protein signal declined to 27% (0.3/1.1) of control.
Discussion
We previously evaluated the quantitative expression of CFP(+) cells in the RGC layer of Thy-1 (CFP +) transgenic mice and found that the number of CFP(+) cells correlates well with the published expected RGC number in this mouse strain.13 The current report evaluates changes in RGC-associated interneurons after isolated RGC axonal ischemia. There is little CFP(+) expression in displaced ChAT(+) amacrine neurons (see Figs. 1, 2), and this finding is confirmed by other investigators.15 Thus, this mouse strain is appropriate for independent analysis of Thy-1 CFP(+) RGCs and displaced amacrine cells in the RGC layer. Amacrine cell numbers have been analyzed other RGC-associated disease conditions, such as glaucoma and optic nerve crush.10,26 In both of these cases, there is little, if any, amacrine cell loss. The data presented suggests that in the mouse model, moderate rAION induction levels do not cause a loss of ChAT(+) amacrine cells. Rather, isolated ON ischemia results only in selective RGC loss. Preservation of RGC soma after axonal loss has been detected in some transgenic models of glaucoma.22 Results in Figure 5 and previous RGC analysis in transgenic mice 21 days after rAION induction,8 suggest that unlike the gradual onset of axonal ischemia seen in the DBA/2J mouse model, sudden isolated axonal ischemia produces a loss of both axons and RGC cell soma.
In the present model, amacrine cell loss apparently occurs in retinas with severe rAION induction, with RGC loss exceeding 70%. This rAION induction level is easily discernable at the gross (fundus) level. While rAION typically results in intraretinal vascular dilation, the retina remains relatively transparent. This dilatation likely results from vascular restriction due to edema at the confined area of the optic nerve head. Severe rAION induction results in significant intraretinal edema, whitening, and intraretinal vessel obscuration. This level of induction is likely to produce ‘spillover’ retinal ischemia, with production of intraretinal capillary ischemia, and more closely approximates a branch retinal vein occlusion (BRVO), or central retinal vein occlusion (CRVO), than a retinal arterial occlusion. The RB-laser model can produce central retinal artery occlusions (CRAOs), with prolonged exposure (>20 seconds) times, and, like clinical specimens, result in loss of the majority of the inner nuclear and retinal ganglion cell layers (data not shown). The results seen at the reported induction times are not the result in retinal arterial occlusion, since there is no disruption of the normal retinal layers.
The present study evaluated only starburst (cholinergic) amacrine neurons, and not other amacrine components. A great advantage of the rAION model is the minimization of direct retinal ischemia, since it selectively affects the capillaries supplying the RGC axons within the anterior optic nerve. This is important when comparing our results with previous studies evaluating amacrine cell responses after transient retinal ischemia/reperfusion. These former studies reveal a pattern of complicated gene and protein expression responses by different amacrine cell subpopulations undergoing direct ischemia.2,3 In one study, parvalbumen gene expression (type AII amacrines) declined to 20%, and immunocytochemically parvalbumin (+) cells declined to <10% of pre-ischemic levels by four weeks post-infarct, suggesting these cells were extraordinarily sensitive to direct ischemia. The same studies revealed that retinal ischemia reduced ChAT gene expression only transiently.3 Nevertheless, there was a significant (∼69%) loss of ChAT(+) amacrine neurons in the INL one month after using this approach.2 Another study using DBA/2J transgenic mice, which exhibit spontaneous glaucoma, revealed an immunohistochemical loss of both cholinergic and GABAergic amacrine cells in 10-month-old animals,26 but used a colorimetric (diaminobenzidine) reaction, and only the peripheral retina was evaluated.
In the present study, we used the entire retina for stereological analysis, and animals were evaluated at one month post-insult. Thus the earlier studies are not directly comparable to the present study. We also did not evaluate whether rAION induces amacrine cell apoptosis. In the present study, there is no detectable loss of ChAT(+) neurons in either the RGC or INL in moderate rAION induction, and a detectable but nonsignificant loss of ChAT(+) amacrine cells in the RGC and IN layers in severe rAION-induced retinas. Taken together, our data suggests that, unlike transient retinal ischemia, isolated ON ischemia does not result in amacrine cell death (at least by 4 weeks post-insult), but rather only when combined with other intra-retinal stress resulting in either transient or permanent retinal ischemia. Changes in amacrine neuron gene expression have also been shown in experimental glaucoma and ON transection.3 These results suggest the care that must be taken when comparing and interpreting different models of retinal damage.
Despite the retention of the amacrine cell population with mild-moderate rAION conditions, there are still changes in amacrine cell function, as evidenced by a reduction in ChAT immunopositivity in amacrine neurons the RGC layer. Amacrine cell function is directly related to visual activity.27 The present study suggests that, at least in the short term, isolated RGC loss does directly influence amacrine cell activity, without amacrine cell death.
The current report also reveals some of the limitations of the current rodent NAION model, but also provides a rationale for discriminating between results associated with pure RGC axonal ischemia, and changes occurring from extension of the induction technique into the retinal milieu. Retinal ischemia is demonstrable at the gross visible level, and is easily distinguishable from isolated ON ischemia. It is therefore important that the retinal fundi of animals be evaluated before, and one to two days after, rAION induction. Interpretation of results from retinas with severe RGC loss must also be evaluated carefully, and results from animals grouped into separate categories. Rodent AION induction is also more variable in mice than in rats8; (Bernstein et al., unpublished data). This is likely due both to differences in size, ease of induction, as well as the highly variable nature of anterior optic nerve vascularization in mice23 compared with rats.28 Therefore, while transgenic mice are useful for evaluating gene-specific responses to RGC ischemia, larger numbers of animals are required for meaningful statistical analysis.
Extrapolation between rodent models and human disease is a risky exercise. However, changes in ON appearance and cell loss occur typically approximately five-fold more quickly than that seen in human disease. The current data suggest that, from the speed of changes occurring in the rodent model, clinical NAION is likely to produce isolated retinal ganglion cell death in the first five months after the ON insult, with associated gene expression changes in amacrine cells, but not amacrine cell death. Effective neuroprotective strategies directed at preservation of retinal and ON function may be directed on RGC preservation and recovery in the short term, without the need for concurrent treatment of the interneuronal component during this time period.
Acknowledgments
The authors thank Adam Puche (Department of Anatomy and Neurobiology, University of Maryland) for his assistance in confocal microscopic and stereological analysis.
Footnotes
Supported by NEI Grants EY-015304 (SLB) and EY-019529 (SLB).
Disclosure: S.L. Bernstein, None; Y. Guo, None
References
- 1. Masland RH. The fundamental plan of the retina. Nat Neurosci. 2001;4:877–886 [DOI] [PubMed] [Google Scholar]
- 2. Dijk F, Kamphuis W. An immunocytochemical study on specific amacrine cell subpopulations in the rat retina after ischemia. Brain Res. 2004;1026:205–217 [DOI] [PubMed] [Google Scholar]
- 3. Dijk F, van Leeuwen S, Kamphuis W. Differential effects of ischemia/reperfusion on amacrine cell subtype-specific transcript levels in the rat retina. Brain Res. 2004;1026:194–204 [DOI] [PubMed] [Google Scholar]
- 4. Masland RH. The many roles of starburst amacrine cells. Trends Neurosci. 2005;28:395–396 [DOI] [PubMed] [Google Scholar]
- 5. Haverkamp S, Inta D, Monyer H, Wassle H. Expression analysis of green fluorescent protein in retinal neurons of four transgenic mouse lines. Neuroscience. 2009;160:126–139 [DOI] [PubMed] [Google Scholar]
- 6. Bernstein SL, Guo Y, Kelman SE, Flower RW, Johnson MA. Functional and cellular responses in a novel rodent model of anterior ischemic optic neuropathy. Invest Ophthalmol Vis Sci. 2003;44:4153–4162 [DOI] [PubMed] [Google Scholar]
- 7. Slater BJ, Mehrabian Z, Guo Y, Hunter A, Bernstein SL. Rodent anterior ischemic optic neuropathy (rAION) induces regional retinal ganglion cell apoptosis with a unique temporal pattern. Invest Ophthalmol Vis Sci. 2008;49:3671–3676 [DOI] [PMC free article] [PubMed] [Google Scholar]
- 8. Goldenberg-Cohen N, Guo Y, Margolis FL, Miller NM, Cohen Y, Bernstein SL. Oligodendrocyte dysfunction following induction of experimental anterior optic nerve ischemia. Invest Ophthalmol Vis Sci. 2005;46:2716–2725 [DOI] [PubMed] [Google Scholar]
- 9. Chen CS, Johnson MA, Flower RA, Slater BJ, Miller NR, Bernstein SL. A primate model of nonarteritic anterior ischemic optic neuropathy (pNAION). Invest Ophthalmol Vis Sci. 2008;49:2985–2992 [DOI] [PMC free article] [PubMed] [Google Scholar]
- 10. Kielczewski JL, Pease ME, Quigley HA. The effect of experimental glaucoma and optic nerve transection on amacrine cells in the rat retina. Invest Ophthalmol Vis Sci. 2005;46:3188–3196 [DOI] [PMC free article] [PubMed] [Google Scholar]
- 11. Gastinger MJ, Singh RS, Barber AJ. Loss of cholinergic and dopaminergic amacrine cells in streptozotocin-diabetic rat and Ins2Akita-diabetic mouse retinas. Invest Ophthalmol Vis Sci. 2006;47:3143–3150 [DOI] [PubMed] [Google Scholar]
- 12. Feng G, Mellor RH, Bernstein M, et al. Imaging neuronal subsets in transgenic mice expressing multiple spectral variants of GFP. Neuron. 2000;28:41–51 [DOI] [PubMed] [Google Scholar]
- 13. Bernstein SL, Guo Y, Slater BJ, Puche A, Kelman SE. Neuron stress and loss following rodent anterior ischemic optic neuropathy in double reporter transgenic mice. Invest Ophthalmol Vis Sci. 2007;48:2304–2310 [DOI] [PubMed] [Google Scholar]
- 14. Leung CK, Lindsey JD, Chen L, Liu Q, Weinreb RN. Longitudinal profile of retinal ganglion cell damage assessed with blue-light confocal scanning laser ophthalmoscopy after ischaemic reperfusion injury. Br J Ophthalmol. 2009;93:964–968 [DOI] [PMC free article] [PubMed] [Google Scholar]
- 15. Raymond ID, Vila A, Huynh UC, Brecha NC. Cyan fluorescent protein expression in ganglion and amacrine cells in a thy1-CFP transgenic mouse retina. Mol Vis. 2008;14:1559–1574 [PMC free article] [PubMed] [Google Scholar]
- 16. Smeyne RJ, Vendrell M, Hayward M, et al. Continuous c-fos expression precedes programmed cell death in vivo. Nature. 1993;363:166–169 [DOI] [PubMed] [Google Scholar]
- 17. Schmitz C, Hof PR. Recommendations for straightforward and rigorous methods of counting neurons based on a computer simulation approach. J Chem Neuroanat. 2000;20:93–114 [DOI] [PubMed] [Google Scholar]
- 18. Schmitz C, Hof PR. Design-based stereology in neuroscience. Neuroscience. 2005;130:813–831 [DOI] [PubMed] [Google Scholar]
- 19. West M, Gundersen HJG. Unbased stereological estimation of the number of neurons in the human hippocampus. J Comp Neurol. 1990;296:1–22 [DOI] [PubMed] [Google Scholar]
- 20. Bernstein SL, Koo JH, Slater BJ, Guo Y, Margolis FL. Analysis of optic nerve stroke by retinal Bex expression. Mol Vis. 2006;12:147–155 [PubMed] [Google Scholar]
- 21. Soto I, Oglesby E, Buckingham BP, et al. Retinal ganglion cells downregulate gene expression and lose their axons within the optic nerve head in a mouse glaucoma model. J Neurosci. 2008;28:548–561 [DOI] [PMC free article] [PubMed] [Google Scholar]
- 22. Buckingham BP, Inman DM, Lambert W, et al. Progressive ganglion cell degeneration precedes neuronal loss in a mouse model of glaucoma. J Neurosci. 2008;28:2735–2744 [DOI] [PMC free article] [PubMed] [Google Scholar]
- 23. May CA, Lutjen-Drecoll E. Morphology of the murine optic nerve. Invest Ophthalmol Vis Sci. 2002;43:2206–2212 [PubMed] [Google Scholar]
- 24. Nadal-Nicolas FM, Jimenez-Lopez M, Sobrado-Calvo P, et al. Brn3a as a marker of retinal ganglion cells: qualitative and quantitative time course studies in naive and optic nerve-injured retinas. Invest Ophthalmol Vis Sci. 2009;50:3860–3868 [DOI] [PubMed] [Google Scholar]
- 25. Quina LA, Pak W, Lanier J, et al. Brn3a-expressing retinal ganglion cells project specifically to thalamocortical and collicular visual pathways. J Neurosci. 2005;25:11595–11604 [DOI] [PMC free article] [PubMed] [Google Scholar]
- 26. Moon JI, Kim IB, Gwon JS, et al. Changes in retinal neuronal populations in the DBA/2J mouse. Cell Tissue Res. 2005;320:51–59 [DOI] [PubMed] [Google Scholar]
- 27. Zhang J, Yang Z, Wu SM. Development of cholinergic amacrine cells is visual activity-dependent in the postnatal mouse retina. J Comp Neurol. 2005;484:331–343 [DOI] [PubMed] [Google Scholar]
- 28. Morrison JC, Johnson EC, Cepurna WO, Funk RH. Microvasculature of the rat optic nerve head. Invest Ophthalmol Vis Sci. 1999;40:1702–1709 [PubMed] [Google Scholar]


