
Figure 6.
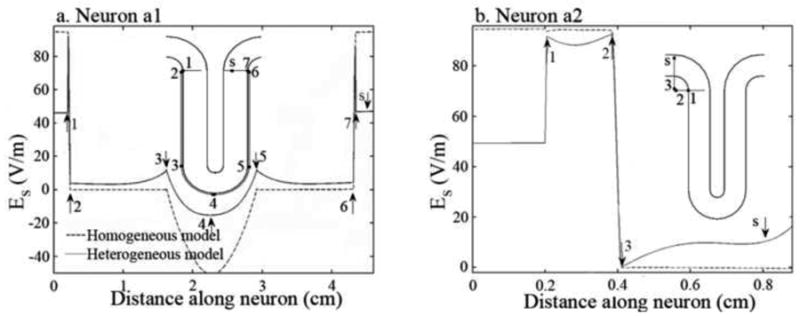
Effective electric field, Es, along neurons a1 and a2 (a-b) for both the homogeneous (dashed line) and heterogeneous (solid line) models. The effective electric field is shown at the instant when it is a maximum (maximum time derivative of current of 67 A/μs). The insets show the neurons on their proper position in the cortex. The arrows on the graphics indicate the most important features of Es (numbers) and the position of the soma (letter “s”). The position along the neuron where these features occur can be seen on the insets.