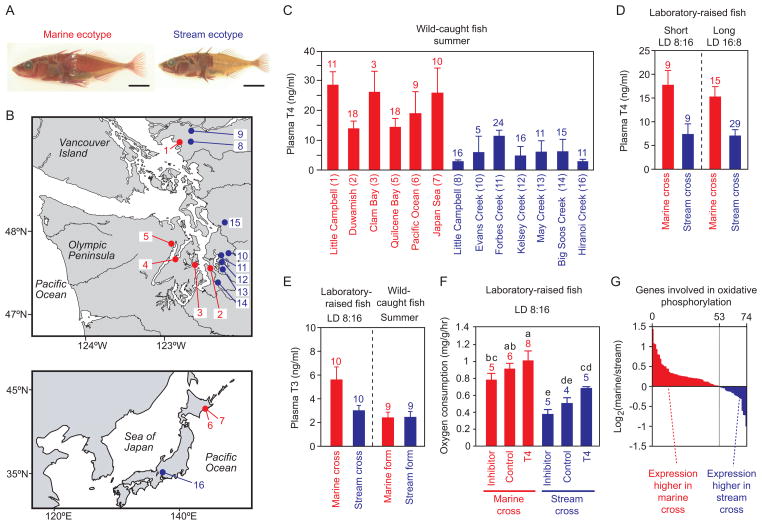
Figure 1. Low plasma thyroid hormone concentration and metabolic rate in stream-resident stickleback.
(A) Representative images of a marine ecotype (Duwamish River, Site 2 in Figure 1B) and a stream-resident ecotype of threespine stickleback (Big Soos Creek, Site 14 in Figure 1B). Skeletal structures are visualized with alizarin red staining. Scale bar = 10 mm.
(B) Map of collection sites in the Pacific Northwest of North America (upper panel) and the Japanese Archipelago (lower panel). Red dots indicate the collection sites of marine fish, while blue dots indicate the collection sites of stream-resident fish. Numbers indicate the sampling sites: (1) Little Campbell River marine; (2) Duwamish River marine; (3) Clam Bay marine; (4) Seabeck Bay marine; (5) Quilcene Bay marine; (6) Akkeshi Pacific Ocean marine; (7) Akkeshi Japan Sea marine; (8) Little Campbell River stream; (9) Salmon River stream; (10) Evans Creek stream; (11) Forbes Creek stream; (12) Kelsey Creek stream; (13) May Creek stream; (14) Big Soos Creek stream; (15) Allen Creek stream; (16) Hiranoi Creek stream.
(C) Plasma T4 concentration (mean ± SEM) of sticklebacks caught in early summer. Red bars indicate marine populations, while blue bars indicate stream-resident populations. Sample sizes for each population are shown above each bar. The number in parenthesis indicates the collection site shown in Figure 1B.
(D) Plasma T4 concentration (mean ± SEM) of laboratory-raised sticklebacks sampled under a short photoperiod (left) or a long photoperiod (right). A grand mean (± SEM) of two independent families for each cross is shown in the graph. Data for each family are available in Figure S1A. Sample sizes for each group are shown above each bar.
(E) Plasma T3 concentration (mean ± SEM) of laboratory-raised sticklebacks sampled under a short photoperiod (left) or wild fish (Little Campbell River marine and stream-resident ecotypes) caught in early summer (right). Sample sizes for each group are shown above each bar.
(F) Effect of thyroid hormone inhibitor (thiourea) and thyroid hormone (thyroxine, T4) treatment on oxygen consumption rate. Oxygen consumption rate was divided by body weight (g) and shown as rate per hour. Mean ± SEM is shown. Sample sizes for each group are shown above each bar. Letters above the bars indicate the results of Waller-Duncan’s posthoc tests after ANOVA.
(G) Expression levels of 74 genes involved in oxidative phosphorylation were compared between marine and stream-resident ecotypes by microarray. Red bars indicate the genes expressed more in marine fish than in stream-resident fish, while the blue bars indicate the genes expressed more in stream-resident fish than in marine fish. Fold change of transcript level (marine fish signal divided by the stream-resident fish signal) is shown as the logarithm to base 2, so 1 indicates that the signal intensity of the transcript is twice as high in marine fish than in stream-resident fish, while -1 indicates the signal intensity of the transcript is twice as high in stream-resident fish than in marine fish.

