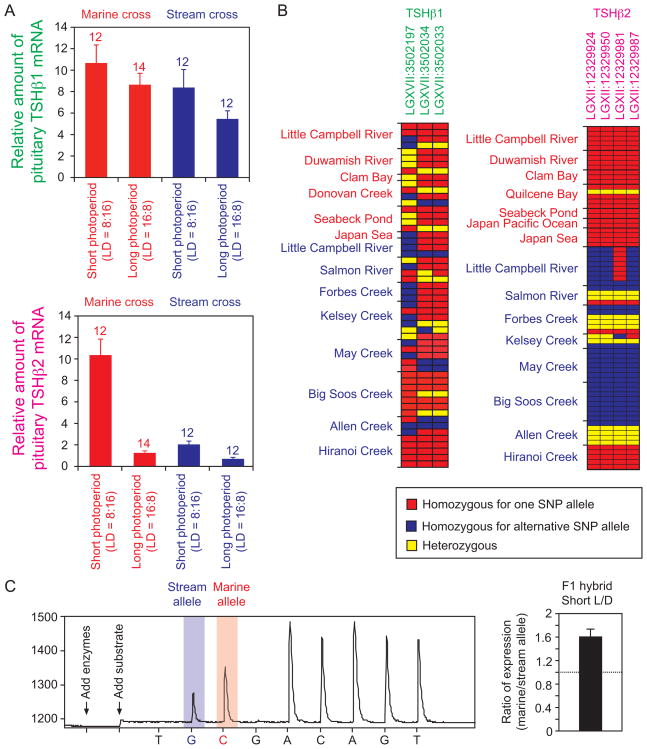
Figure 2. Divergent TSHβ2 transcript level and cis-regulatory sequence between marine and stream-resident sticklebacks.
(A) Photoperiodic response of total pituitary TSHβι (upper panel) and TSHβ2 (lower panel) mRNA level. A grand mean (± SEM) of two independent families is shown in the graph. Sample sizes for each group are shown above each bar. Expression level was determined by comparing the amplification threshold cycle to that of a serially diluted standard cDNA sample, followed by multiplication of the amount of RNA isolated from each pituitary gland.
(B) Three representative SNPs at the TSHβ1 locus did not show any significant segregation between marine and stream-resident ecotypes (left panel). Four representative SNPs at the TSHβ2 locus significantly differed in frequency between marine and stream-resident ecotypes (right panel). Results of genetic analyses are available in Table S1. In both panels, red squares indicate that an individual is homozygous for one SNP allele, blue squares indicate that an individual is homozygous for the alternative allele, and yellow squares indicate that an individual is heterozygous. Details of SNP information are shown in Figure S2.
(C) Pyrosequencing of pituitary cDNA in F1 hybrid fish between a Little Campbell River marine female and a Little Campbell River-resident male. The left panel indicates a representative pyrogram showing a higher peak on C than on G at a SNP site (for the SNP, see Fig. S2G). The right panel indicates the ratio (mean ± SEM) of marine to stream-resident TSHβ2 allelic expression (n = 10).

