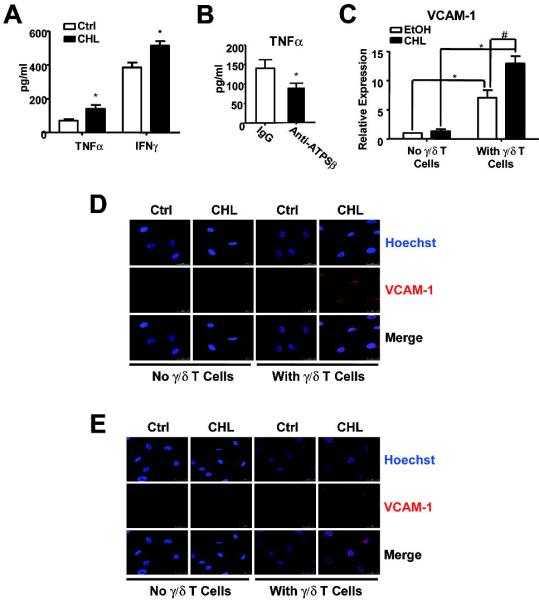
Figure 5. γ/δ T lymphocytes and ECs were activated by their interaction.

(A) HUVECs were pretreated with cholesterol for 2 hr and then coincubated with γ/δ T cells for 24 hr. (B) HUVECs were pre-treated with cholesterol for 2 hr and then coincubated with γ/δ T cells in the presence of IgG or anti-ATPSβ antibody (50 μg/ml) for 24 hr. Supernatant was collected, and the levels of TNFα and IFNγ were determined by ELISA. Graphs show amount of TNFα or IFNγ secreted to the media with T cells under different conditions. *P<0.05 versus controls. (C,D) HUVECs were pretreated with ethanol or cholesterol for 2 hr, and then incubated with or without γ/δ T cells for 24 hr. The VCAM-1 expression in ECs was analyzed by real-time PCR (C) and immunostaining (D). (E) The collected co-cultured medium was incubated with new HUVECs for 24 hr, VCAM-1 expression was analyzed by immunostaining with anti-VCAM-1 antibody and Hoechst 33258. Pseudo color images show the merge of VCAM-1 (red) and nucleus (blue). Results are representative from 3 independent experiments.
