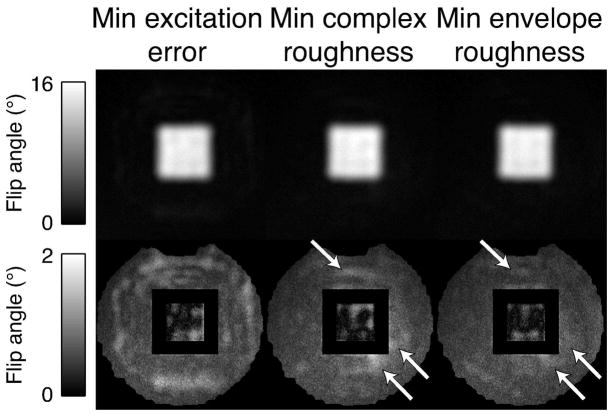
Figure 7.
Top row: Excitation patterns acquired with minimum excitation error pulses, minimum complex roughness pulses, and minimum envelope roughness pulses. Bottom row: excitation errors, masked by passband and stopband masks. The minimum envelope roughness set achieves the lowest RMS stopband excitation error; white arrows indicate areas with significant error reductions compared to the minimum complex roughness pattern.

