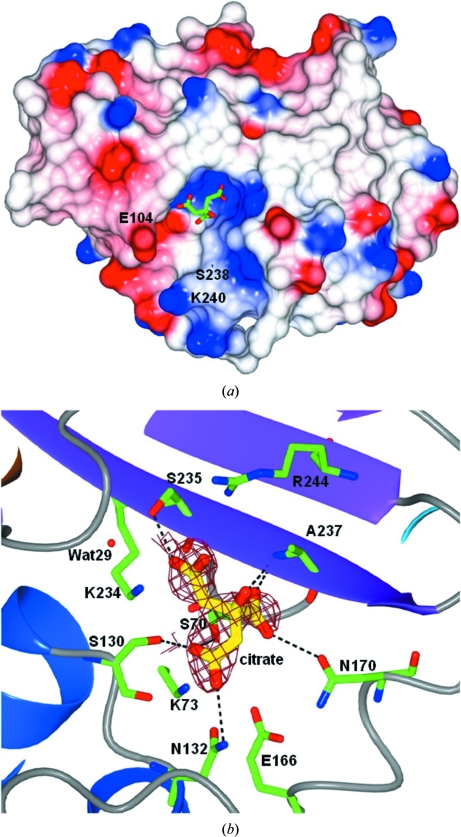
Figure 2.
(a) Molecular surface coloured by electrostatic potential (red, negative charge; blue, positive charge). The predominant positive charge present in the active-site cavity drives the binding of the citrate anion (green sticks). (b) View of the active-site cavity of one of the TEM-72 subunits showing the citrate anion (yellow sticks) with a superimposed OMIT map calculated using the refined phases obtained without the contribution of the citrate molecule (yellow sticks; map contoured at 2.5σ). The active-site residues are shown as green sticks. Figures were prepared using CCP4MG (Potterton et al., 2002 ▶).

