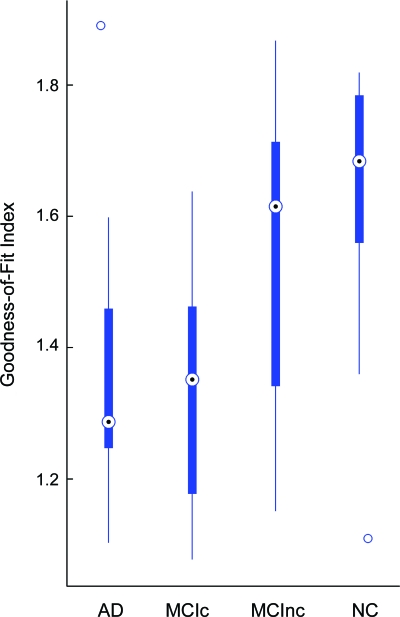
Figure 2. Box whisker plot of goodness-of-fit (GOF) index.
Box whisker plot of GOF index for subjects with Alzheimer disease (AD), mild cognitive impairment converters (MCIc), mild cognitive impairment nonconverters (MCInc), and normal control (NC) groups. Plot depicts the median, interquartile range, and range of values for each group.

