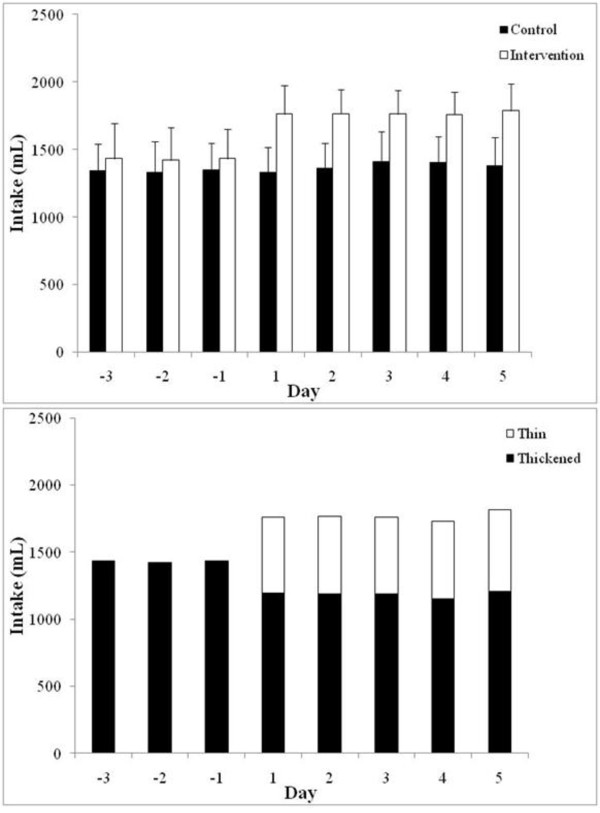
Figure 3.
Total daily oral liquid intake by the patients in the study. Comparison of the mean total daily oral liquid intake by patients in the control and intervention groups (A). Patients in the control group were allowed only thickened fluids for the total eight day period (Days -3 to -1 pre-intervention and Days 1 to 5 post-intervention). Patients in the intervention group were allowed access to water for the five day post-intervention period. The findings indicate a significant difference in the total fluid intake in the intervention group compared to the control group after the allowance of water (Days 1 to 5). Comparison of the mean proportions of daily intake of thickened and thin (water) fluids in the intervention group (B). The findings indicate only a modest decrease in the volume of daily intake of thickened fluids and an overall increase in the total fluid intake, following the allowance of water in the intervention group (Days -3 to -1 compared to Days 1 to 5).

