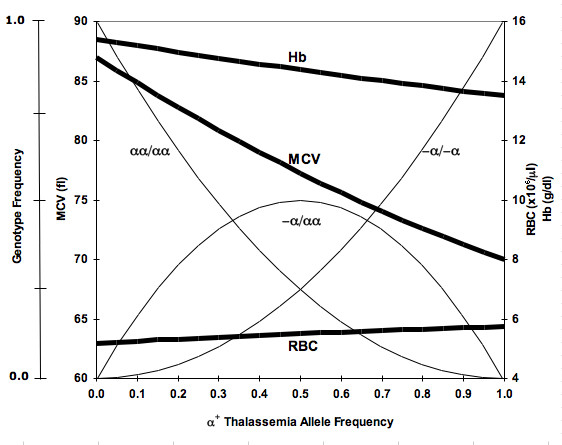
Figure 4.

Mean Hb, MCV and RBC values (thick lines) at different α+ thalassemia allele frequencies. Genotype frequencies (thin lines) are of αα/αα (normal homozygote), -α/αα (α+ thalassemia heterozygote) and -α/-α (α+ thalassemia homozygote). Data were created using Hardy-Weinberg equation and published values for the three genotypes [8,18].
