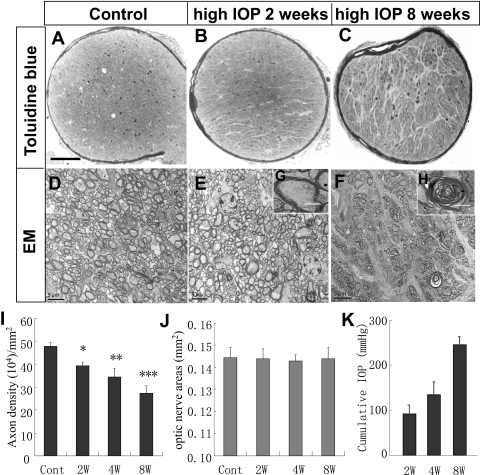
Figure 3.
Elevated IOP-induced RGC axon degeneration. (A–C) Photomicrographs of toluidine blue–stained optic nerve sections taken from (A) control eye and the eyes at (B) 2 and (C) 8 weeks after IOP elevation. Note the increase of glial scarring in the optic nerve cross-section taken at 8 weeks after induction of IOP elevation. Scale bar, 100 μm. (D–F) Electronic microscopy photomicrographs of optic nerve sections taken from the (D) control or at (E) 2 or (F) 8 weeks after microbead injection. Scale bar, 5 μm. Insets: high-magnification images of (G) healthy and (H) degenerating axons. Scale bar, 2 μm. (I) Quantification of RGC axon densities in control (cont) or at 2 (2W), 4 (4W), and 8 (8W; with a second injection of microbeads on day 23) weeks after the induction of IOP elevation. Values are mean ± SD (n = 6/group; Student's t-test; *P < 0.05; **P < 0.01; ***P < 0.001 compared with the control group). (J) Measurement of the areas of optic nerve cross-sections in mice. No significant differences in optic nerve areas were noted among the groups examined. (K) Cumulative exposure to elevated IOP in experimental groups presented in (I) at 2, 4, and 8 weeks after the induction of IOP elevation.

