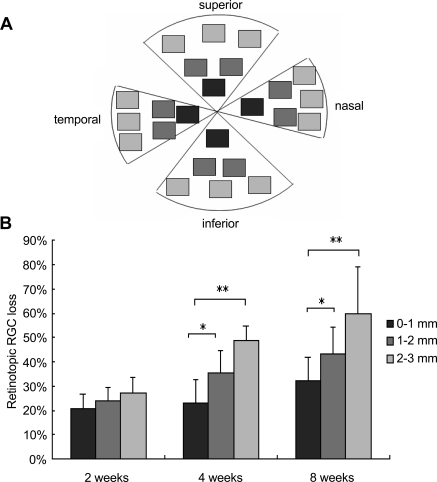
Figure 8.
Retinotopic RGC loss in mice with elevated IOP. (A) Schematic illustration of RGC sampling and counting in the flat mount retina. (B) Quantification of RGC loss in the central, intermediate, and peripheral retinal regions of retinal flat mounts. Significant difference in the rate of RGC loss between the central and peripheral retina was noted at 4 and 8 weeks, but not at 2 weeks, after IOP elevation. MB, microbeads. Values are mean ± SD. *P < 0.01; **P < 0.001.

