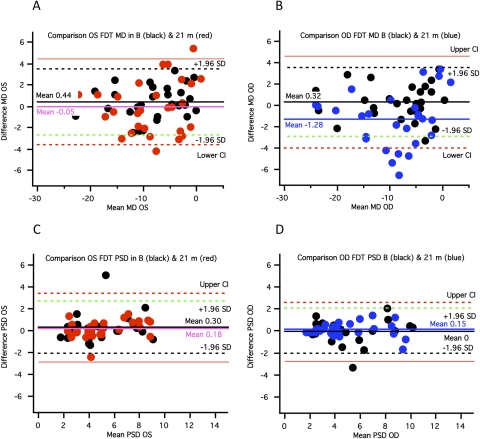
Figure 5.
Bland-Altman plots for FDT MD and PSD results for 55 eyes at baseline and 21 months. (A, B) Plots of the difference in MD values for the final visit (mean, 21 months; red and blue dots) versus the baseline visit (black dots) for left (red) and for right (blue) eyes. (C, D) Plots of the differences in PSD values for the final visit versus the baseline visit. Green dashed line: −1.96 SD for baseline data and limits of agreement. Black dashed lines: +1.96 SD for baseline data and limits of agreement. Thin black lines: 95% CI of the limits of agreement.

