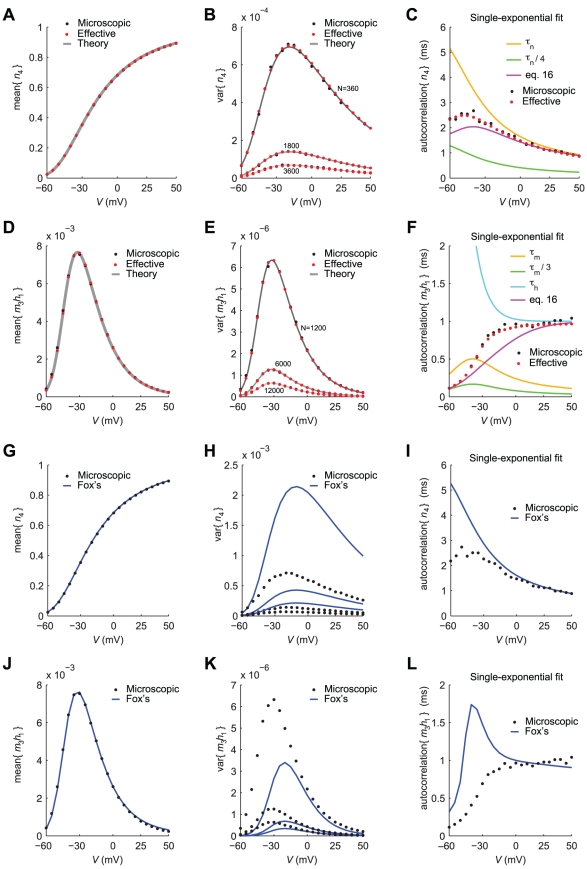
Figure 2. Steady-state statistical properties of the fraction of open channels  , under voltage-clamp.
Panels A–C refer to delayed-rectifier potassium channels (see Fig. 1B and Table 2), whereas panels D–F refer to fast-inactivating sodium channels (see Fig. 1A and Table 2). Black and red dots result from the simulations of the exact kinetic schemes and from our diffusion approximation, respectively. The continuous traces in A,B,D,E are drawn by the analytical expressions derived in the text, and refer to an increasing number of simulated channels (namely, 360, 1800, 3600). The dependence on the membrane-patch voltage  is studied for the mean of
  (A,D) and for its variance (B,E). For an increasing number
  of channels, the variance decreases, as expected. Panels C,F show the time constant of the best-fit single-exponential, which approximates the covariance of
  (see Eq. 17). The mismatch between actual best-fit values and the characteristic subunit gating time-constants (
 ,
,  ,
,  , shown for comparison), clearly indicates that great care should be taken in deriving accurate Langevin-kind formulations. Panels G–L repeat the very same comparisons presented in panels A–F, for the Langevin-approximation introduced by Fox and coworkers (Fox, 1997; Fox and Lu, 1994): the variance of potassium currents is overestimated (H), whereas the variance of sodium currents is underestimated (K). In addition, the autocorrelation properties are not reproduced correctly (I,L).

