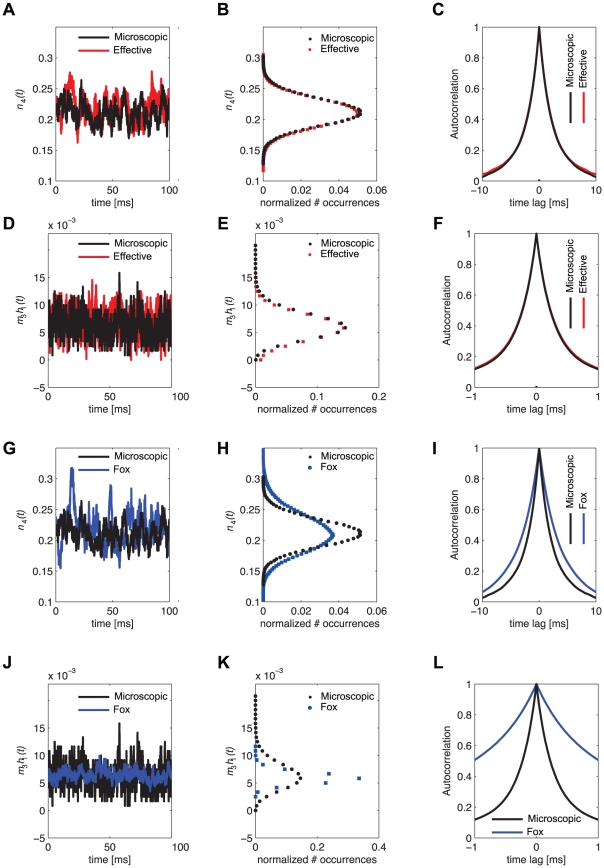
Figure 3. Sample time-series of the fraction of open channels  , under voltage-clamp (
 ).
).
Panels A–C refer to delayed-rectifier potassium channels (see Fig. 1B and Table 2), and panels D–F to fast-inactivating sodium channels (see Fig. 1A and Table 2). Black and red traces and dots result from the simulations of the exact kinetic schemes and from our diffusion approximation, respectively. The continuous traces in A,D are steady-state realisations of the fraction of open potassium and open sodium channels, respectively, while panels B,E display the amplitude histogram. Under the conditions considered here (360 potassium and 1200 sodium channels), the Gauss-distributed effective stochastic process approximates well the microscopic model. Panels C,F report the autocorrelation function of channel noise fluctuations, demonstrating an excellent agreement of the effective and microscopic simulations (see also Fig. 2C,F). Panels G–L repeat the same comparisons presented in panels A–F, for the Langevin-approximation introduced by Fox and coworkers (Fox, 1997; Fox and Lu, 1994). As in Fig. 2H,K the variance of potassium currents is overestimated (G–H) while the variance of sodium currents is underestimated (J–K). In addition, the autocorrelation properties are not reproduced correctly (I,L). Additional simulations, for distinct values of the holding membrane potential, are provided as Supporting Information (Figures 5–10 in Text S1).

